はじめに
データ間のネットワークやフローのような相互関係を表現する際には円形でのデータ可視化がよく行われます。下記のような図はChord Diagramと呼ばれ、各データの相互関係を分かりやすく美しく可視化することができます。

本記事では、matplotlibをベースに個人開発したパッケージ pyCirclize (GitHub, Qiita紹介記事) を利用して、PythonでChord Diagramをプロットする方法を紹介します。
pyCirclizeのインストール
pyCirclizeはPyPIとconda-forgeにそれぞれパッケージを登録しているので、pipまたはcondaコマンドでインストール可能です。
PyPIパッケージ
pip install pycirclize
Condaパッケージ
conda install -c conda-forge pycirclize
Chord Diagramプロット方法
pyCirclizeを利用したChord Diagramのプロットコード例・図例を以降に記載しています。
1. 行列テーブルからプロット
プロット方法は簡単で、Circos.initialize_from_matrix()メソッドから行列データ読み込み及びChord Diagramプロット設定を行い、savefig()メソッドで図を出力するだけです。プロット設定は各要素間のスペース度数やカラーマップ、ラベル位置・サイズ、リンクの方向等の設定が可能です。
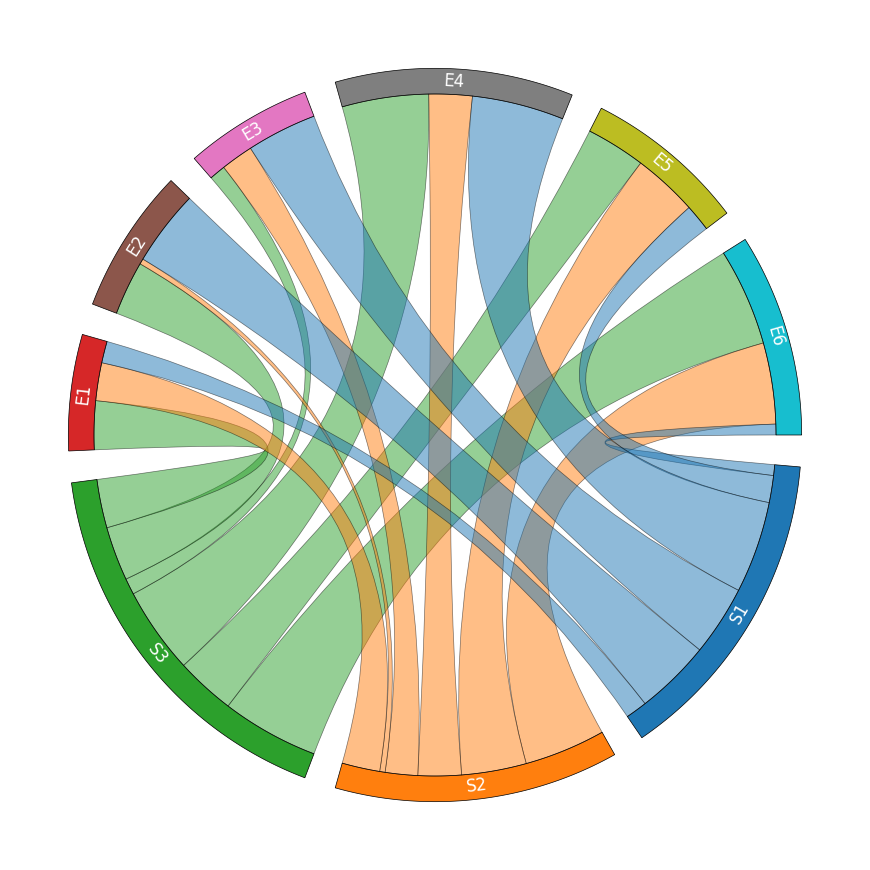
1-1. Example1 (3 x 6 行列)
from pycirclize import Circos
import pandas as pd

# Create matrix dataframe (3 x 6)
row_names = ["S1", "S2", "S3"]
col_names = ["E1", "E2", "E3", "E4", "E5", "E6"]
matrix_data = [
    [4, 14, 13, 17, 5, 2],
    [7, 1, 6, 8, 12, 15],
    [9, 10, 3, 16, 11, 18],
]
matrix_df = pd.DataFrame(matrix_data, index=row_names, columns=col_names)
matrix_df.to_csv("matrix1.tsv", sep="\t")

# Initialize from matrix (Can also directly load tsv matrix file)
circos = Circos.initialize_from_matrix(
    matrix_df,
    start=-265,
    end=95,
    space=5,
    r_lim=(93, 100),
    cmap="tab10",
    label_kws=dict(r=94, size=12, color="white"),
    link_kws=dict(ec="black", lw=0.5),
)

circos.savefig("chord_diagram_matrix1.png")
	E1	E2	E3	E4	E5	E6
S1	4	14	13	17	5	2
S2	7	1	6	8	12	15
S3	9	10	3	16	11	18
1-2. Example2 (10 x 10 行列)
from pycirclize import Circos
import pandas as pd

# Create matrix data (10 x 10)
row_names = list("ABCDEFGHIJ")
col_names = row_names
matrix_data = [
    [51, 115, 60, 17, 120, 126, 115, 179, 127, 114],
    [108, 138, 165, 170, 85, 221, 75, 107, 203, 79],
    [108, 54, 72, 123, 84, 117, 106, 114, 50, 27],
    [62, 134, 28, 185, 199, 179, 74, 94, 116, 108],
    [211, 114, 49, 55, 202, 97, 10, 52, 99, 111],
    [87, 6, 101, 117, 124, 171, 110, 14, 175, 164],
    [167, 99, 109, 143, 98, 42, 95, 163, 134, 78],
    [88, 83, 136, 71, 122, 20, 38, 264, 225, 115],
    [145, 82, 87, 123, 121, 55, 80, 32, 50, 12],
    [122, 109, 84, 94, 133, 75, 71, 115, 60, 210],
]
matrix_df = pd.DataFrame(matrix_data, index=row_names, columns=col_names)
matrix_df.to_csv("matrix2.tsv", sep="\t")

# Initialize from matrix (Can also directly load tsv matrix file)
circos = Circos.initialize_from_matrix(
    matrix_df,
    space=3,
    r_lim=(93, 100),
    cmap="tab10",
    ticks_interval=500,
    label_kws=dict(r=94, size=12, color="white"),
)

circos.savefig("chord_diagram_matrix2.png")
	A	B	C	D	E	F	G	H	I	J
A	51	115	60	17	120	126	115	179	127	114
B	108	138	165	170	85	221	75	107	203	79
C	108	54	72	123	84	117	106	114	50	27
D	62	134	28	185	199	179	74	94	116	108
E	211	114	49	55	202	97	10	52	99	111
F	87	6	101	117	124	171	110	14	175	164
G	167	99	109	143	98	42	95	163	134	78
H	88	83	136	71	122	20	38	264	225	115
I	145	82	87	123	121	55	80	32	50	12
J	122	109	84	94	133	75	71	115	60	210

1-3. Example3 (10 x 2 行列)
from pycirclize import Circos
import pandas as pd

# Create matrix data (10 x 2)
row_names = list("ABCDEFGHIJ")
col_names = list("KL")
matrix_data = [
    [83, 79],
    [90, 118],
    [165, 81],
    [121, 77],
    [187, 197],
    [177, 8],
    [141, 127],
    [29, 27],
    [95, 82],
    [107, 39],
]
matrix_df = pd.DataFrame(matrix_data, index=row_names, columns=col_names)
matrix_df.to_csv("matrix3.tsv", sep="\t")

# Initialize from matrix (Can also directly load tsv matrix file)
circos = Circos.initialize_from_matrix(
    matrix_df,
    space=2,
    cmap="Set3",
    label_kws=dict(size=12),
    link_kws=dict(direction=1, ec="black", lw=0.5)
)

circos.savefig("chord_diagram_matrix3.png")
	K	L
A	83	79
B	90	118
C	165	81
D	121	77
E	187	197
F	177	8
G	141	127
H	29	27
I	95	82
J	107	39

2. 遷移テーブルからプロット
各要素間の移動・遷移量を示すようなデータテーブル(例: A -> B [値=10])をMatrix.parse_fromto_table()メソッドで行列テーブルに変換し、前節と同様にChord Diagramをプロットすることができます。
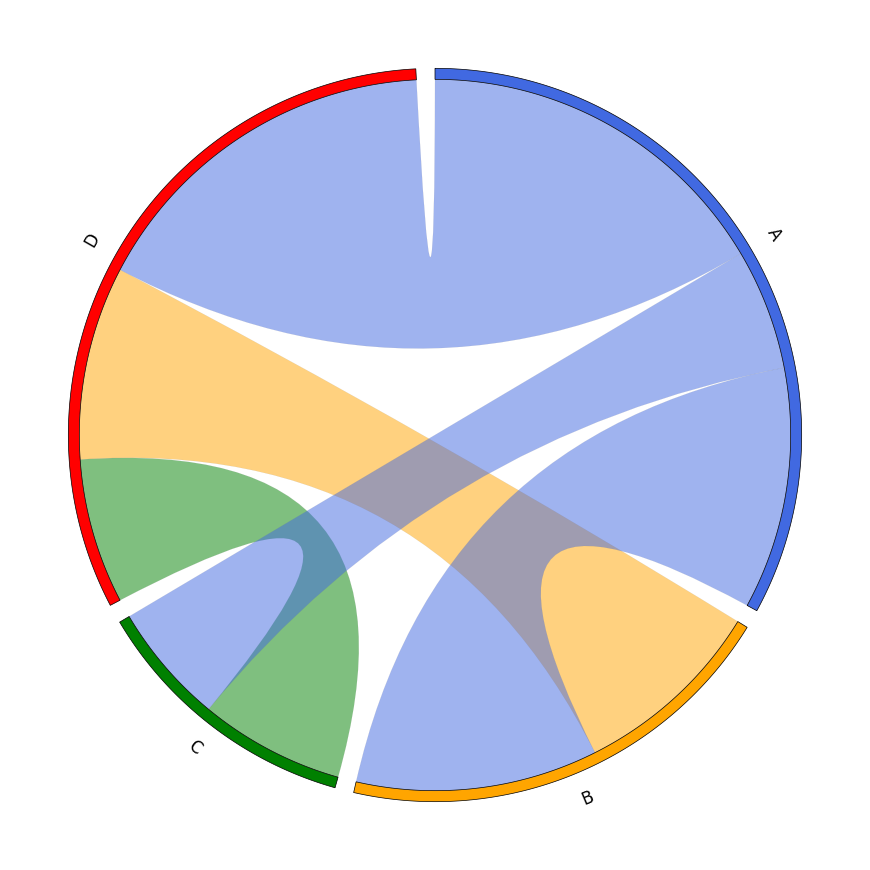
2-1. Example1
from pycirclize import Circos
from pycirclize.parser import Matrix
import pandas as pd

# Create from-to table dataframe & convert to matrix
fromto_table_df = pd.DataFrame(
    [
        ["A", "B", 10],
        ["A", "C", 5],
        ["A", "D", 15],
        ["B", "D", 8],
        ["C", "D", 6],
    ],
    columns=["from", "to", "value"],  # Column name is optional
)
fromto_table_df.to_csv("fromto_table1.tsv", sep="\t", index=False)
matrix = Matrix.parse_fromto_table(fromto_table_df)

circos = Circos.initialize_from_matrix(
    matrix,
    space=3,
    cmap=dict(A="royalblue", B="orange", C="green", D="red"),
    label_kws=dict(size=12),
)

circos.savefig("chord_diagram_fromto_table1.png")
from	to	value
A	B	10
A	C	5
A	D	15
B	D	8
C	D	6
2-2. Example2
from pycirclize import Circos
from pycirclize.parser import Matrix
import pandas as pd

# Create from-to table dataframe & convert to matrix
fromto_table_df = pd.DataFrame(
    [
        ["A", "B", 10],
        ["A", "C", 5],
        ["A", "D", 15],
        ["A", "E", 20],
        ["A", "F", 3],
        ["B", "A", 3],
        ["B", "G", 15],
        ["F", "D", 13],
        ["F", "E", 2],
        ["E", "A", 20],
        ["E", "D", 6],
    ],
    columns=["from", "to", "value"],  # Column name is optional
)
fromto_table_df.to_csv("fromto_table2.tsv", sep="\t", index=False)
matrix = Matrix.parse_fromto_table(fromto_table_df)

circos = Circos.initialize_from_matrix(
    matrix,
    space=3,
    cmap="viridis",
    ticks_interval=5,
    label_kws=dict(size=12, r=110),
    link_kws=dict(direction=1, ec="black", lw=0.5),
)

circos.savefig("chord_diagram_fromto_table2.png")
from	to	value
A	B	10
A	C	5
A	D	15
A	E	20
A	F	3
B	A	3
B	G	15
F	D	13
F	E	2
E	A	20
E	D	6

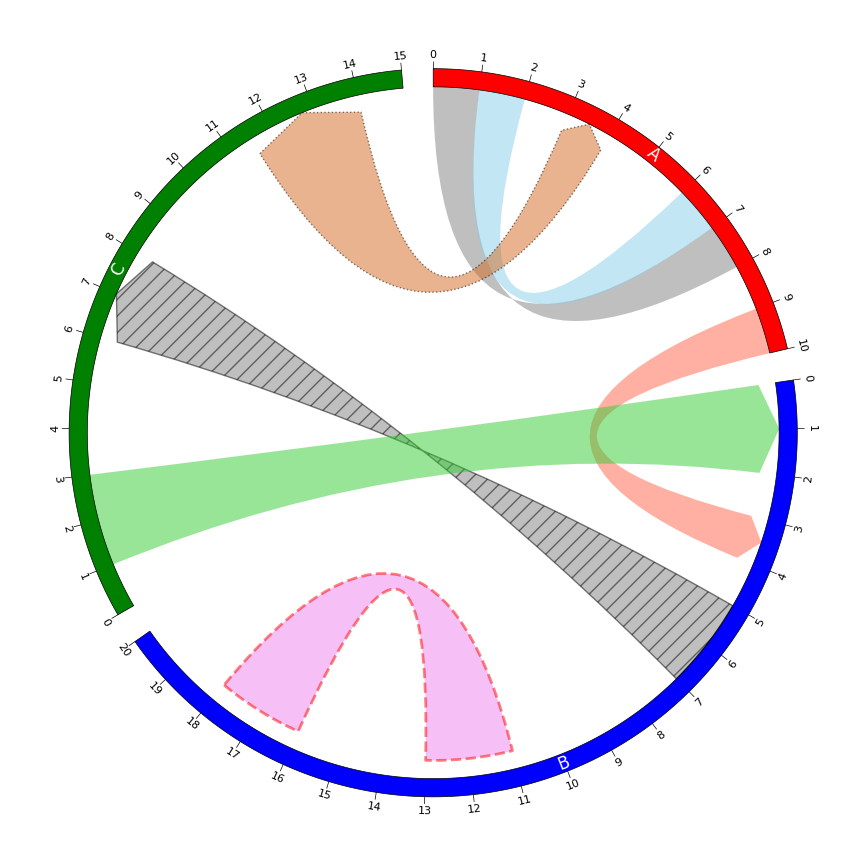
3. その他プロット
前項までの汎用的なChord Diagram以外にも、pyCirclizeの各種APIを活用することで以下のようなプロットを実行することもできます。詳細なプロットAPIに興味がある人は、Getting StartedやPlot API Exampleドキュメントを参照してみてください。
from pycirclize import Circos

sectors = {"A": 10, "B": 20, "C": 15}
name2color = {"A": "red", "B": "blue", "C": "green"}
circos = Circos(sectors, space=5)
for sector in circos.sectors:
    track = sector.add_track((95, 100))
    track.axis(fc=name2color[sector.name])
    track.text(sector.name, color="white", size=12)
    track.xticks_by_interval(1)

# Plot links in various styles
circos.link(("A", 0, 1), ("A", 7, 8))
circos.link(("A", 1, 2), ("A", 7, 6), color="skyblue")
circos.link(("A", 9, 10), ("B", 4, 3), direction=1, color="tomato")
circos.link(("B", 5, 7), ("C", 6, 8), direction=1, ec="black", lw=1, hatch="//")
circos.link(("B", 18, 16), ("B", 11, 13), r1=90, r2=90, color="violet", ec="red", lw=2, ls="dashed")
circos.link(("C", 1, 3), ("B", 2, 0), direction=1, color="limegreen")
circos.link(("C", 11.5, 14), ("A", 4, 3), direction=2, color="chocolate", ec="black", lw=1, ls="dotted")

circos.savefig("chord_diagram_other.png")
最後に
本記事では、pyCirclizeを利用したChord Diagramの基本的なプロット方法について紹介しました。pyCirclizeにはChord Diagram以外にも様々な円形プロットを可能とする機能を実装しているので、興味がある人がいればGitHubリポジトリを参照してみてください。
PythonではpyCirclizeの他にもd3blocksやholoviewsといったライブラリでもChord Diagramのプロットが可能ですが、プロットAPIのシンプルさやmatplotlibベースであるための拡張のしやすさ等ではpyCirclizeが少し優れているかなと思っています。ただ出力図へのインタラクティブな操作ができない点では明確に劣っているため、そういった機能が必要な人はd3blockやholoviewsを選択したほうがいいかもしれません。