Raspberry PiにPrometheusとGrafanaをインストールして、Raspberry Pi自身を監視してみました。
環境
Raspberry Pi 3
Raspberry Pi OS(2020-05-27版)
Prometheusのインストール
Raspberry Piの公式リポジトリから導入できます。
prometheusがPrometheus本体、prometheus-node-exporterはOSのメトリクス情報を取得するものです。
sudo apt install prometheus prometheus-node-exporter
インストールが完了すると、すでにサービスとして起動した状態となります。
2020/6/27時点でインストールされたバージョンは以下の通り。最新バージョンはPrometheusが2.19.2、Node exporterが1.0.1なので少し古そうですね。
pi@raspberrypi:~ $ prometheus --version
prometheus, version 2.7.1+ds (branch: debian/sid, revision: 2.7.1+ds-3)
  build user:       pkg-go-maintainers@lists.alioth.debian.org
  build date:       20190210-18:10:02
  go version:       go1.11.5
pi@raspberrypi:~ $ prometheus-node-exporter --version
node_exporter, version 0.17.0+ds (branch: debian/sid, revision: 0.17.0+ds-3)
  build user:       pkg-go-maintainers@lists.alioth.debian.org
  build date:       20190131-17:33:42
  go version:       go1.11.5
Prometheusの動作確認
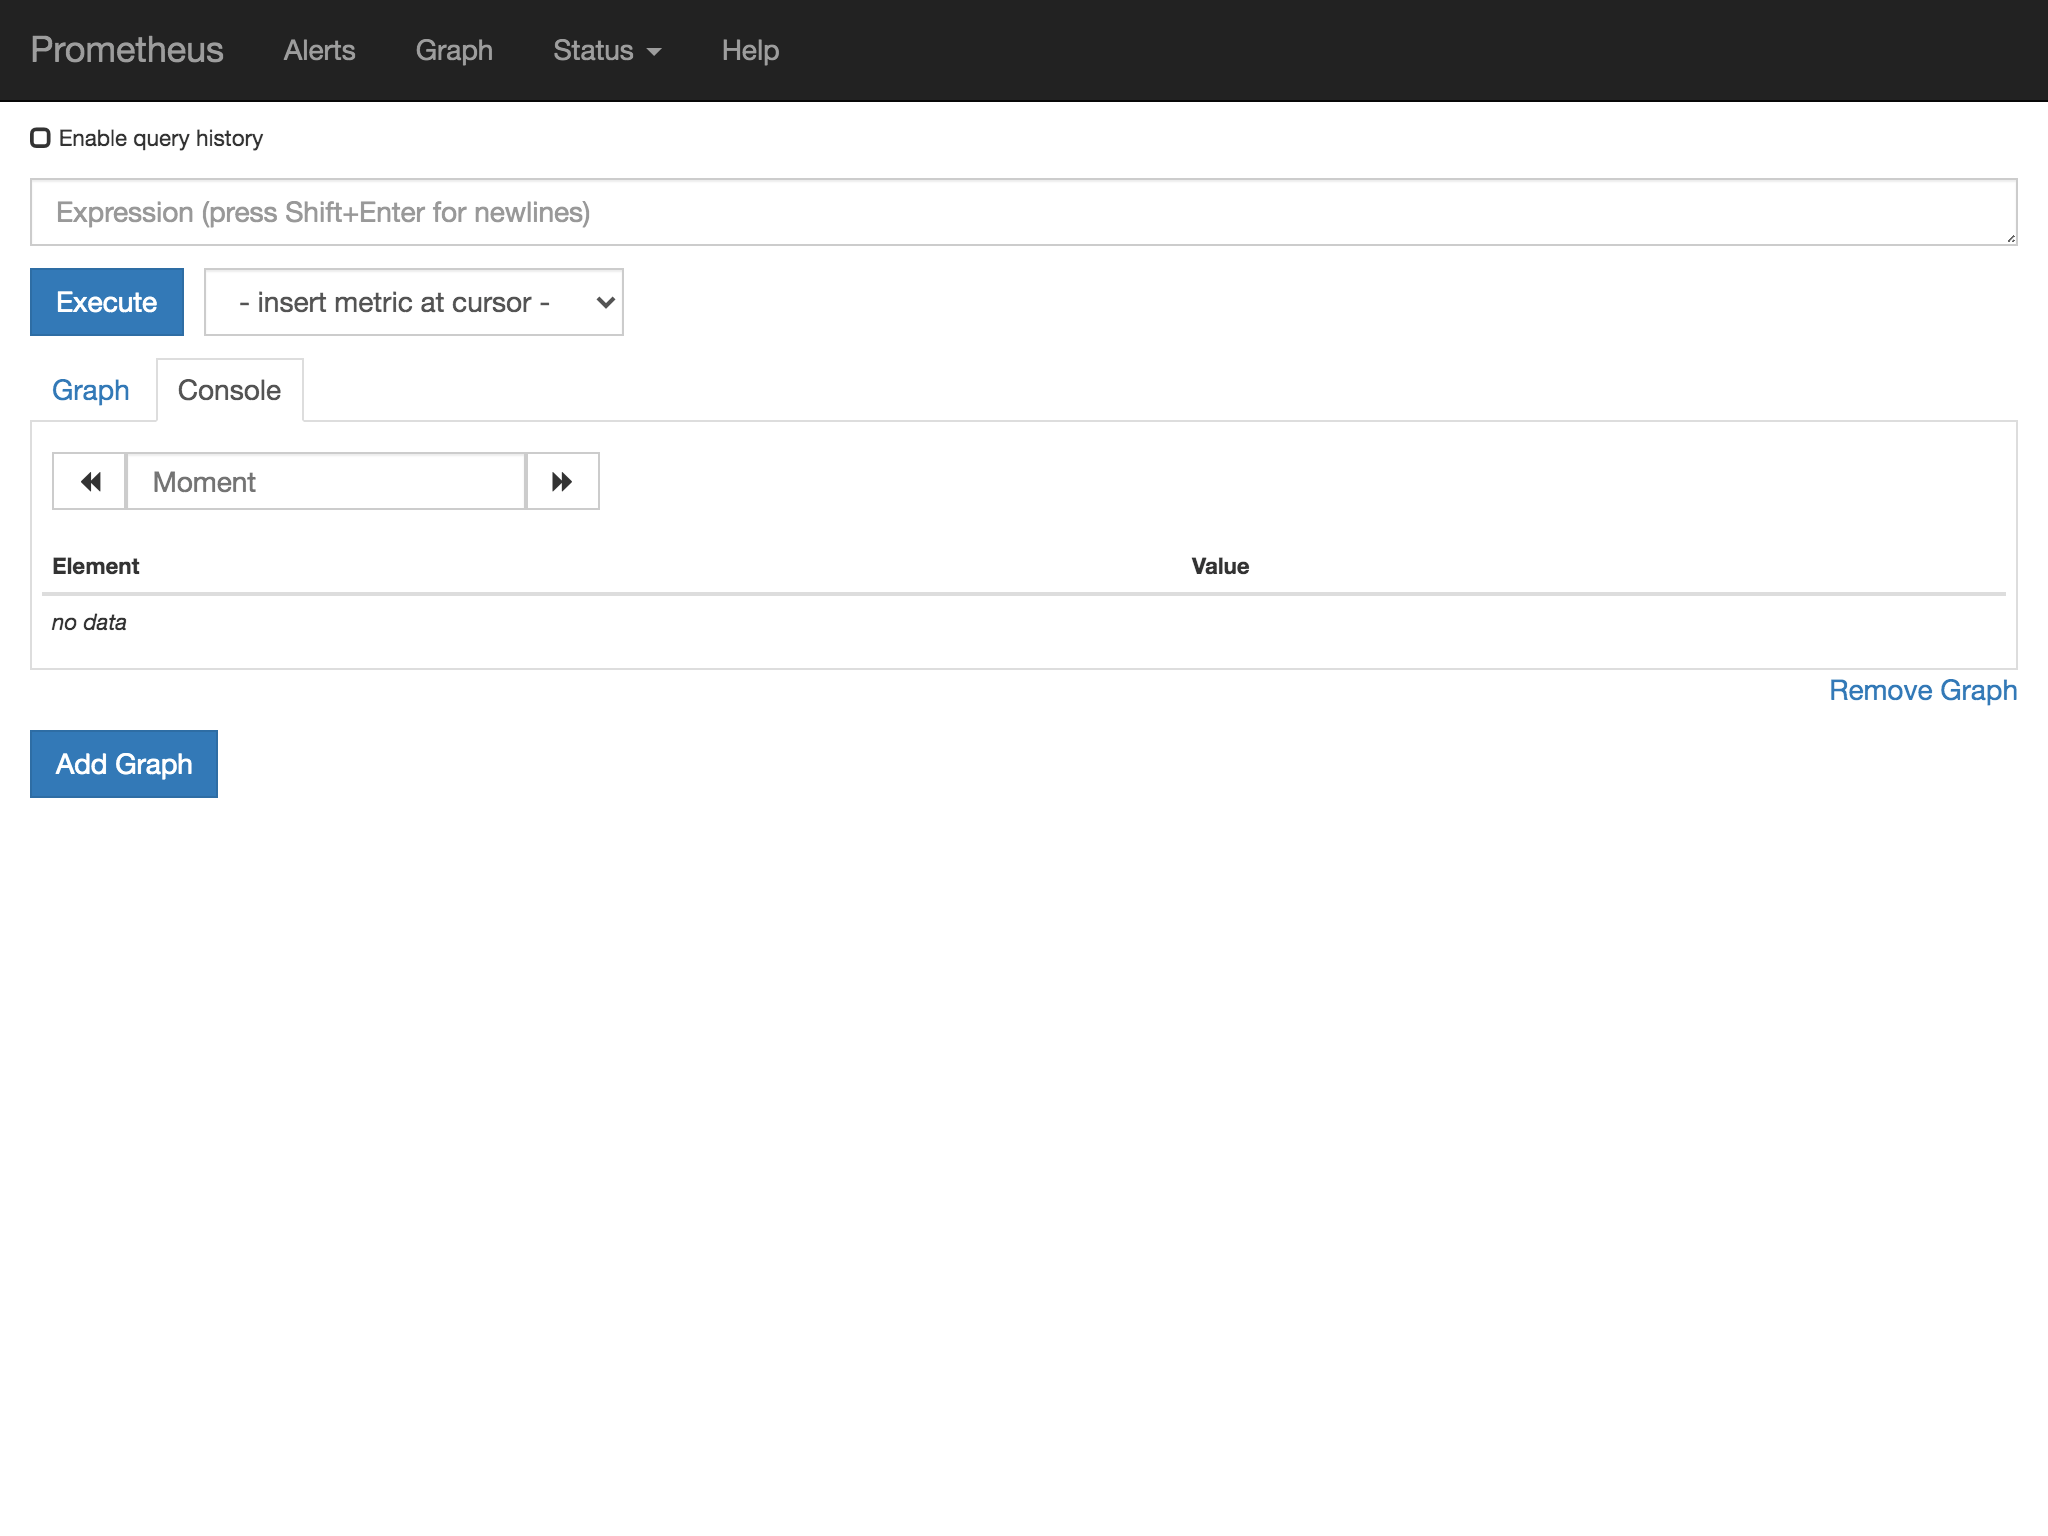
Raspberry Piからhttp://localhost:9090/、または他のPCからhttp://raspberrypi.local:9090/にアクセスすると、PrometheusのWeb画面にアクセスできます。
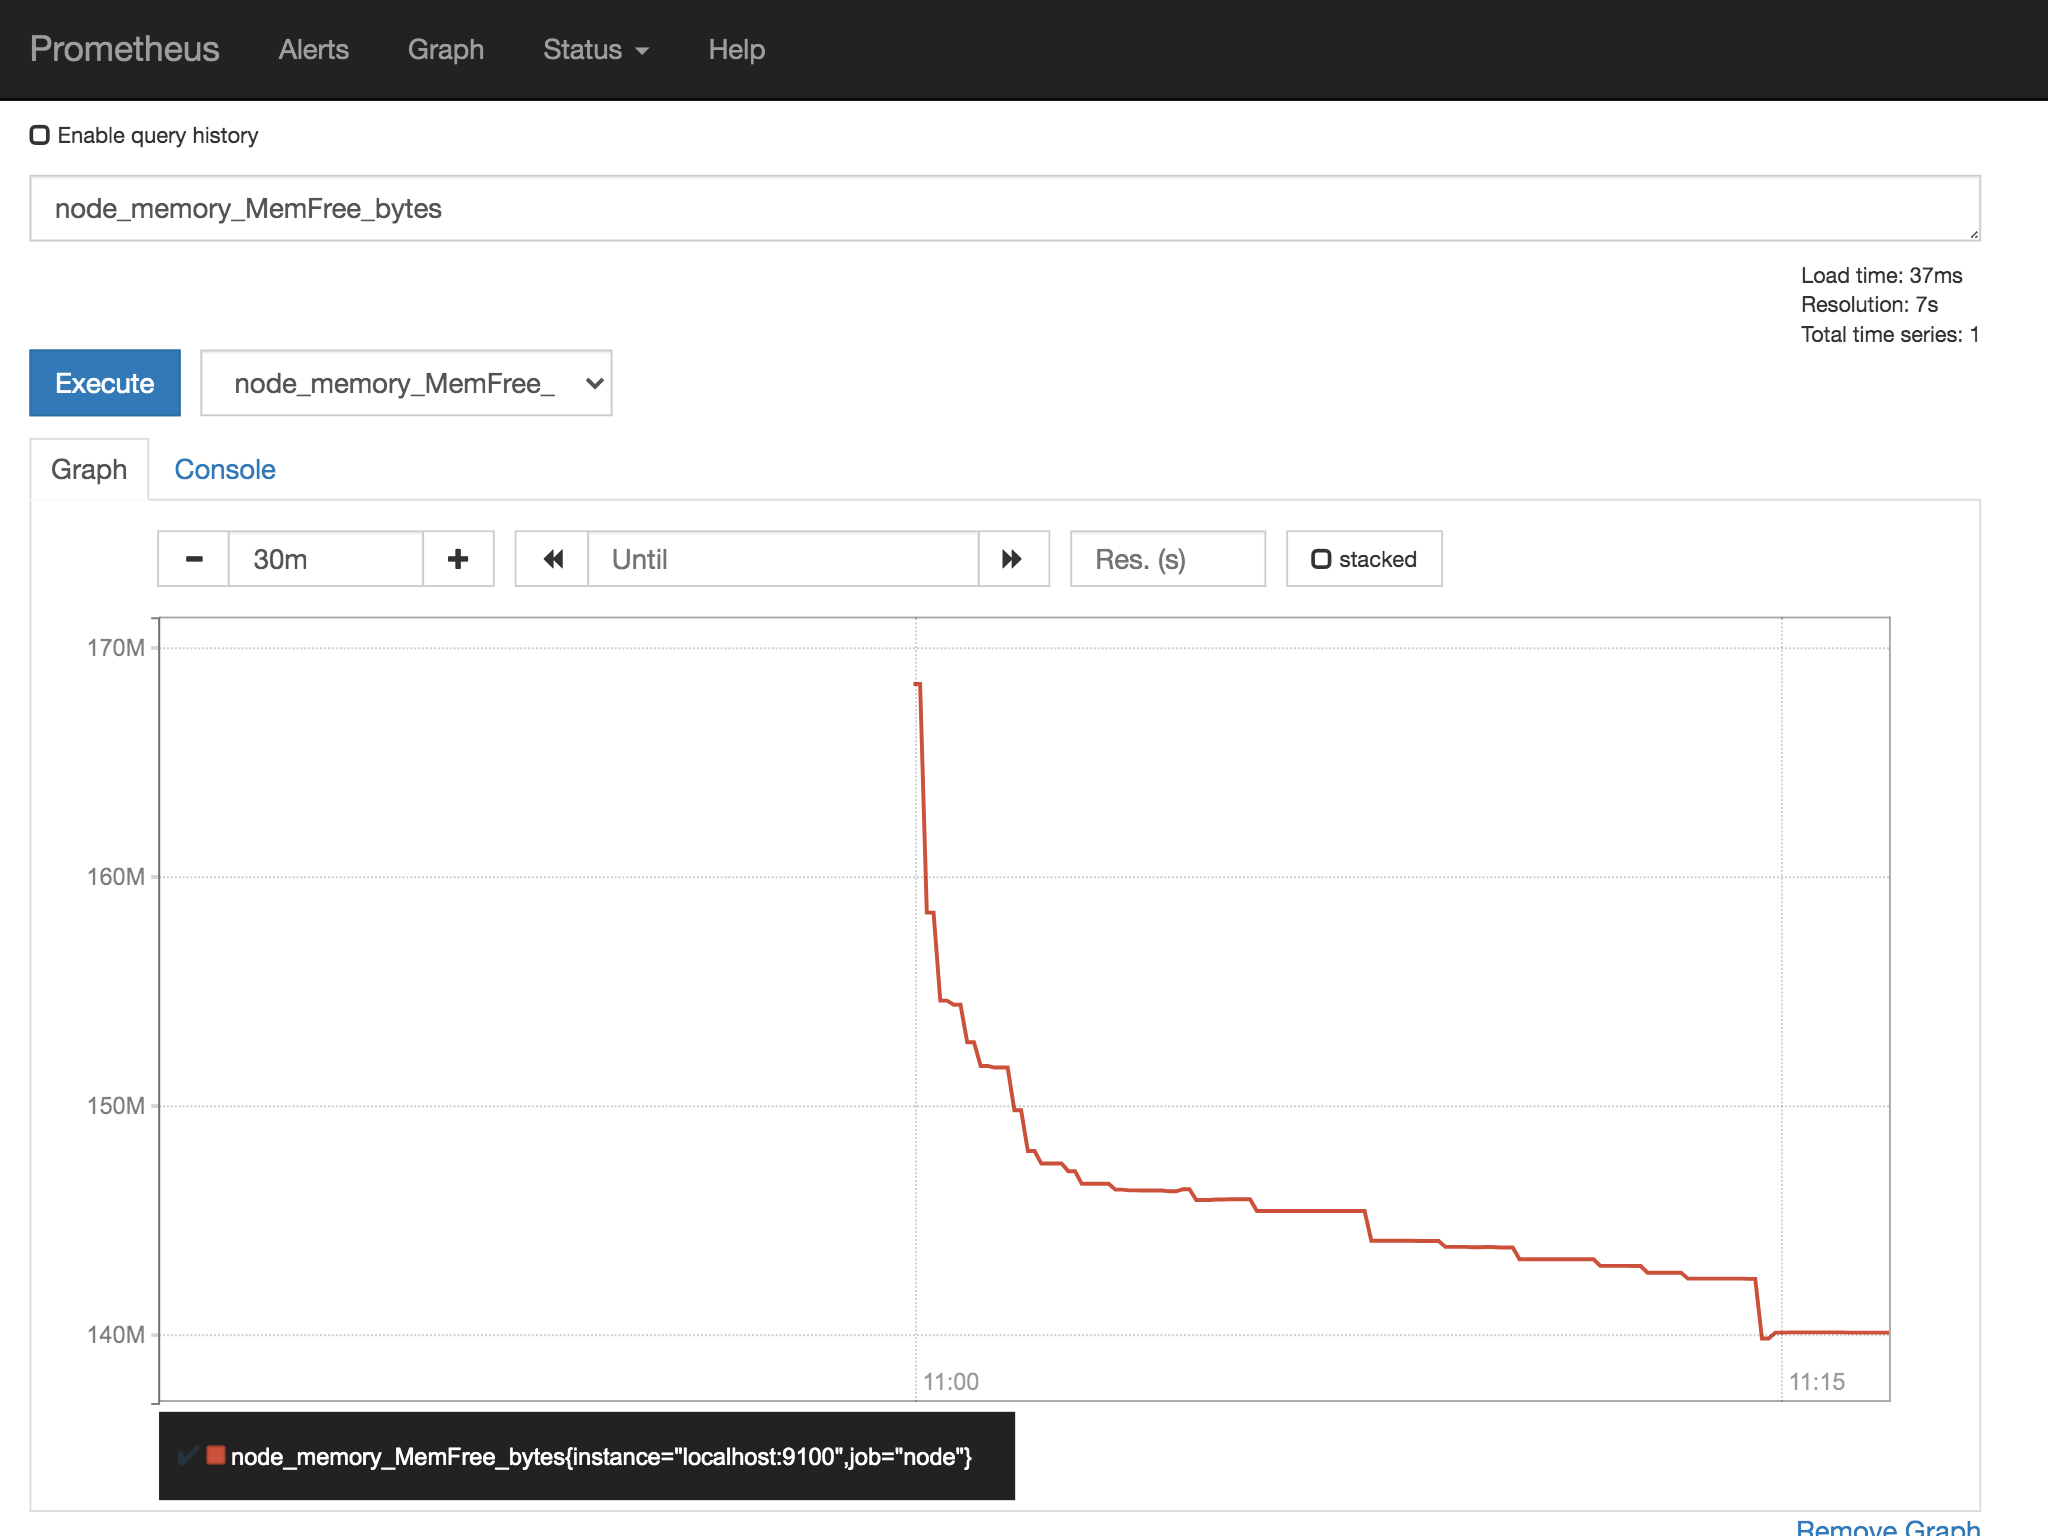
タブをGraphに切り替えて、メトリクスを選ぶとグラフが表示されます。
すごいですね。簡単ですね。
凝ったグラフを作りたいときは、Grafanaの出番です。
Grafanaのインストール
Grafanaは公式リポジトリでは提供されていないようですが、Grafanaの公式サイトでARM向けのdebパッケージが提供されています。
wget https://dl.grafana.com/oss/release/grafana_7.0.4_armhf.deb
sudo apt install ./grafana_7.0.4_armhf.deb
Grafanaはインストールしただけでは起動しないようです。
sudo systemctl status grafana-server.service
Grafanaの動作確認
Grafanaは3000ポートで起動しますので、http://localhost:3000/またはhttp://raspberrypi.local:3000/でアクセスできます。
初期ユーザーはadmin、パスワードもadminです。
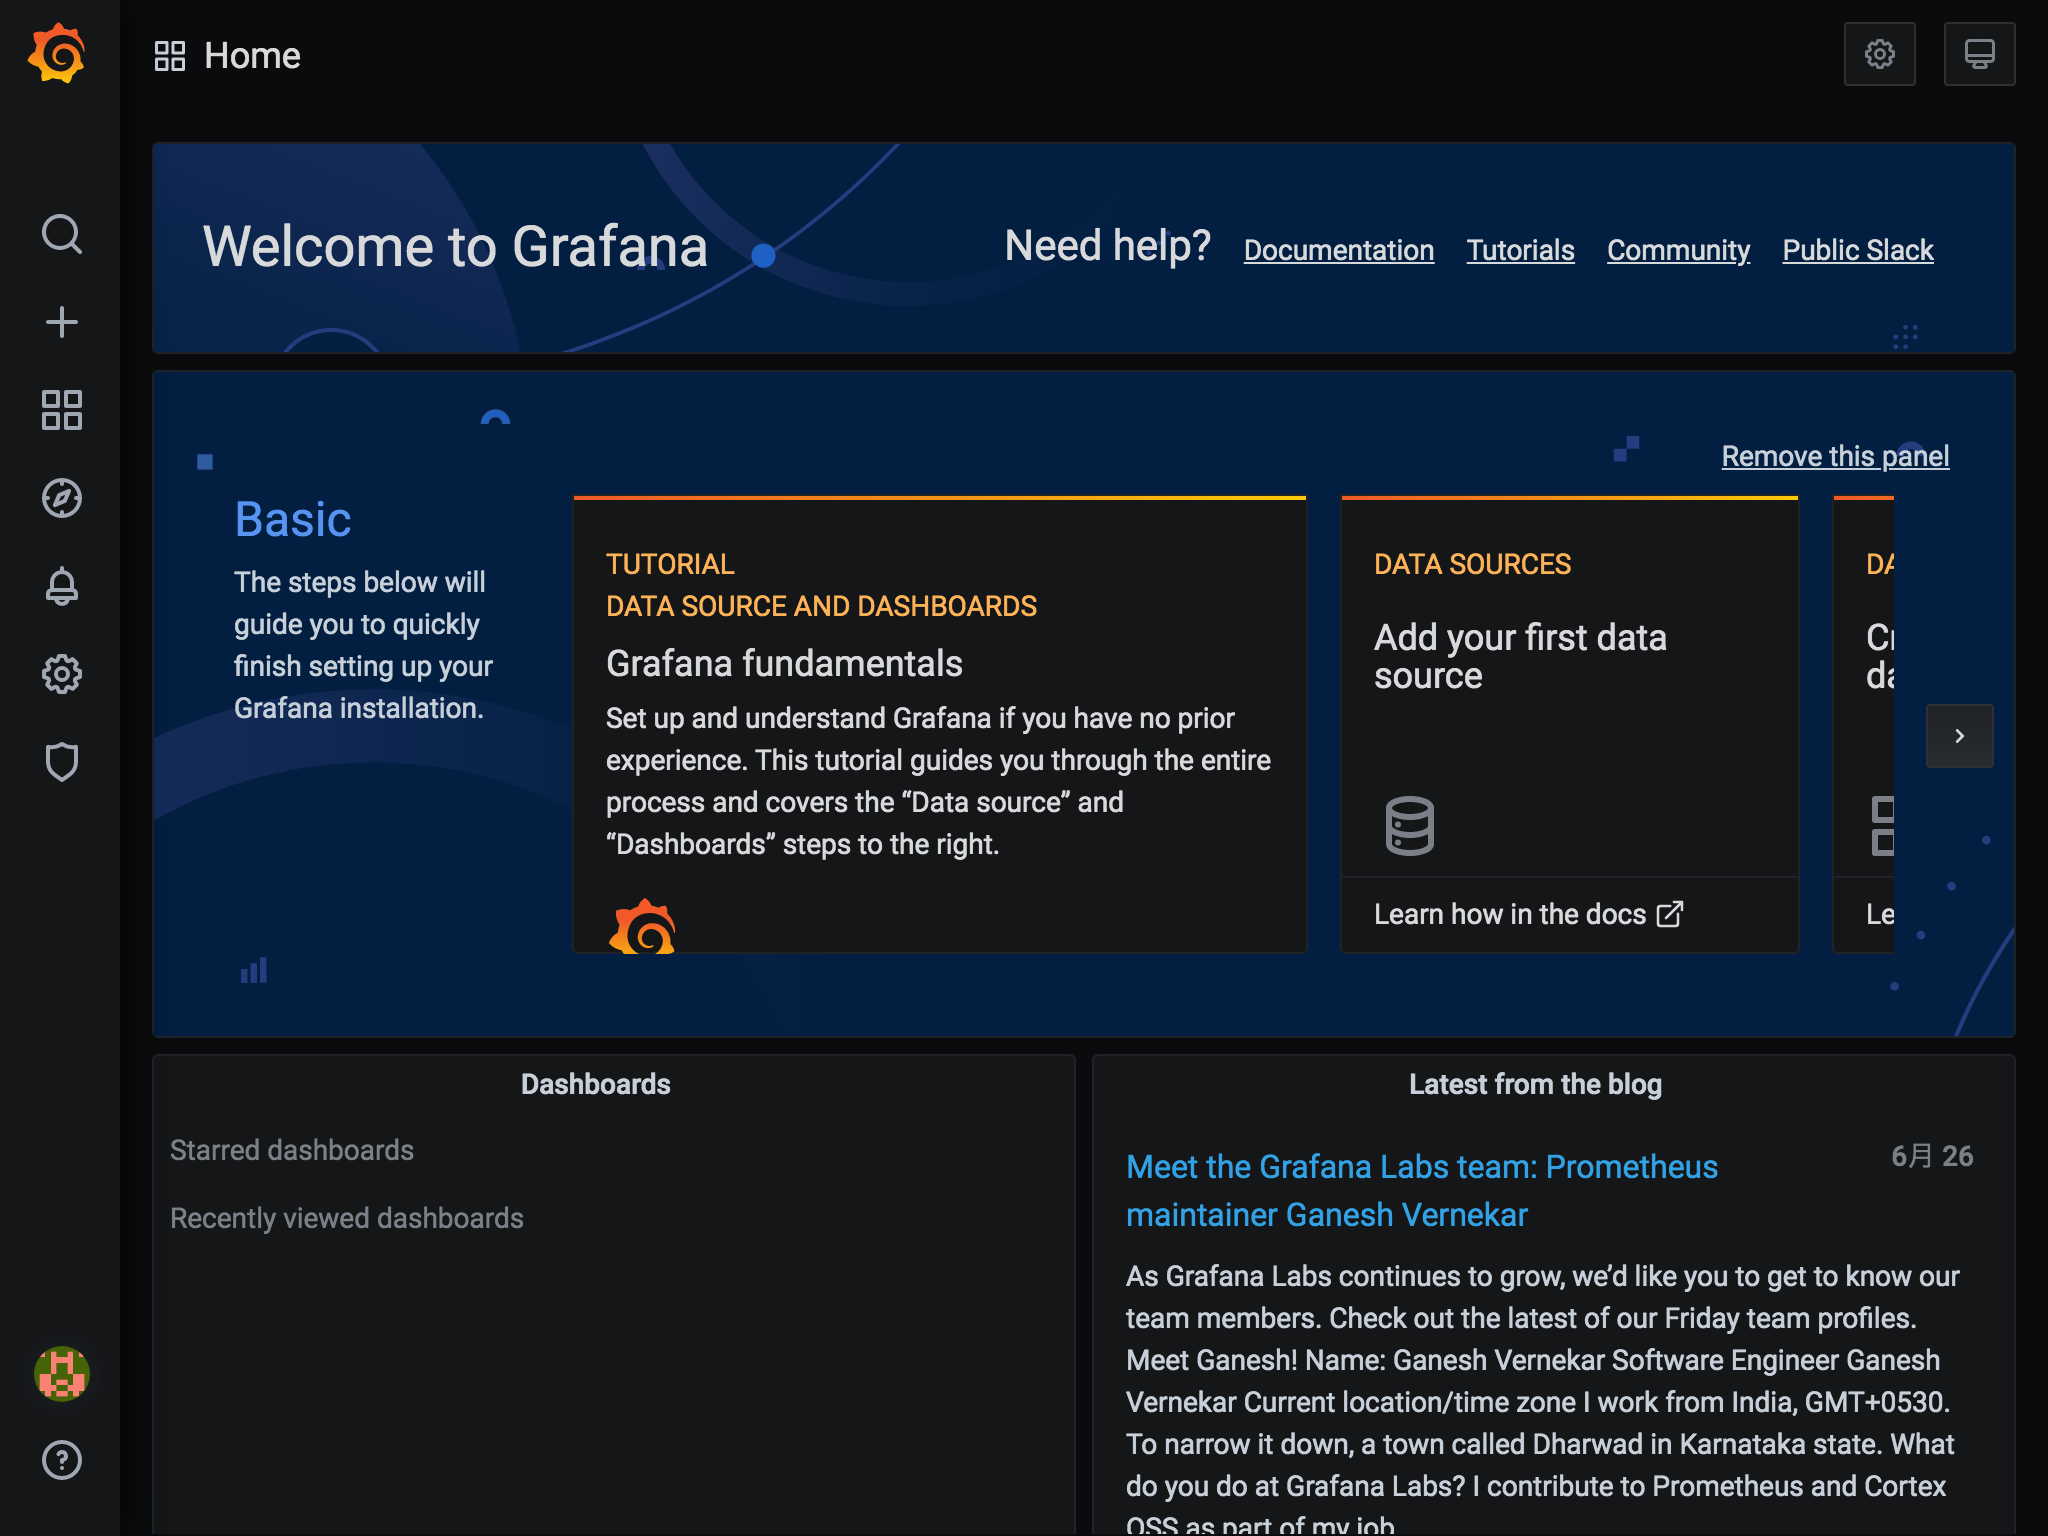
ログイン後はこんな感じ。
データソースの作成
GrafanaでPrometheusのデータを扱うため、データソースの設定を行います。
- 左メニューの
Configuration(ギアアイコン)からData Sourcesを選択します。

-
Add Data sourceを選択します。

-
Prometheusの右のSelectボタンを押します。

- URLに
http://localhost:9090と入力し、その他はデフォルトのままでSave & Testボタンを押します。

これでデータソースの設定が完了です。
続けてダッシュボードを作成します。
ダッシュボードの作成
ダッシュボード画面は一から作ることもできますが、すでに作成済みのダッシュボードが公式サイトで公開されています。オフィシャルなものからコミュニティのものまでたくさんあります。
https://grafana.com/grafana/dashboards
ダッシュボードにはそれぞれIDがあり、IDを登録することで、自分のGrafanaで使用することができます。
- 左メニューの
Dashboards(四角が4つのアイコン)から、Manageを選択します。

- 画面右端の
Importを選択します。
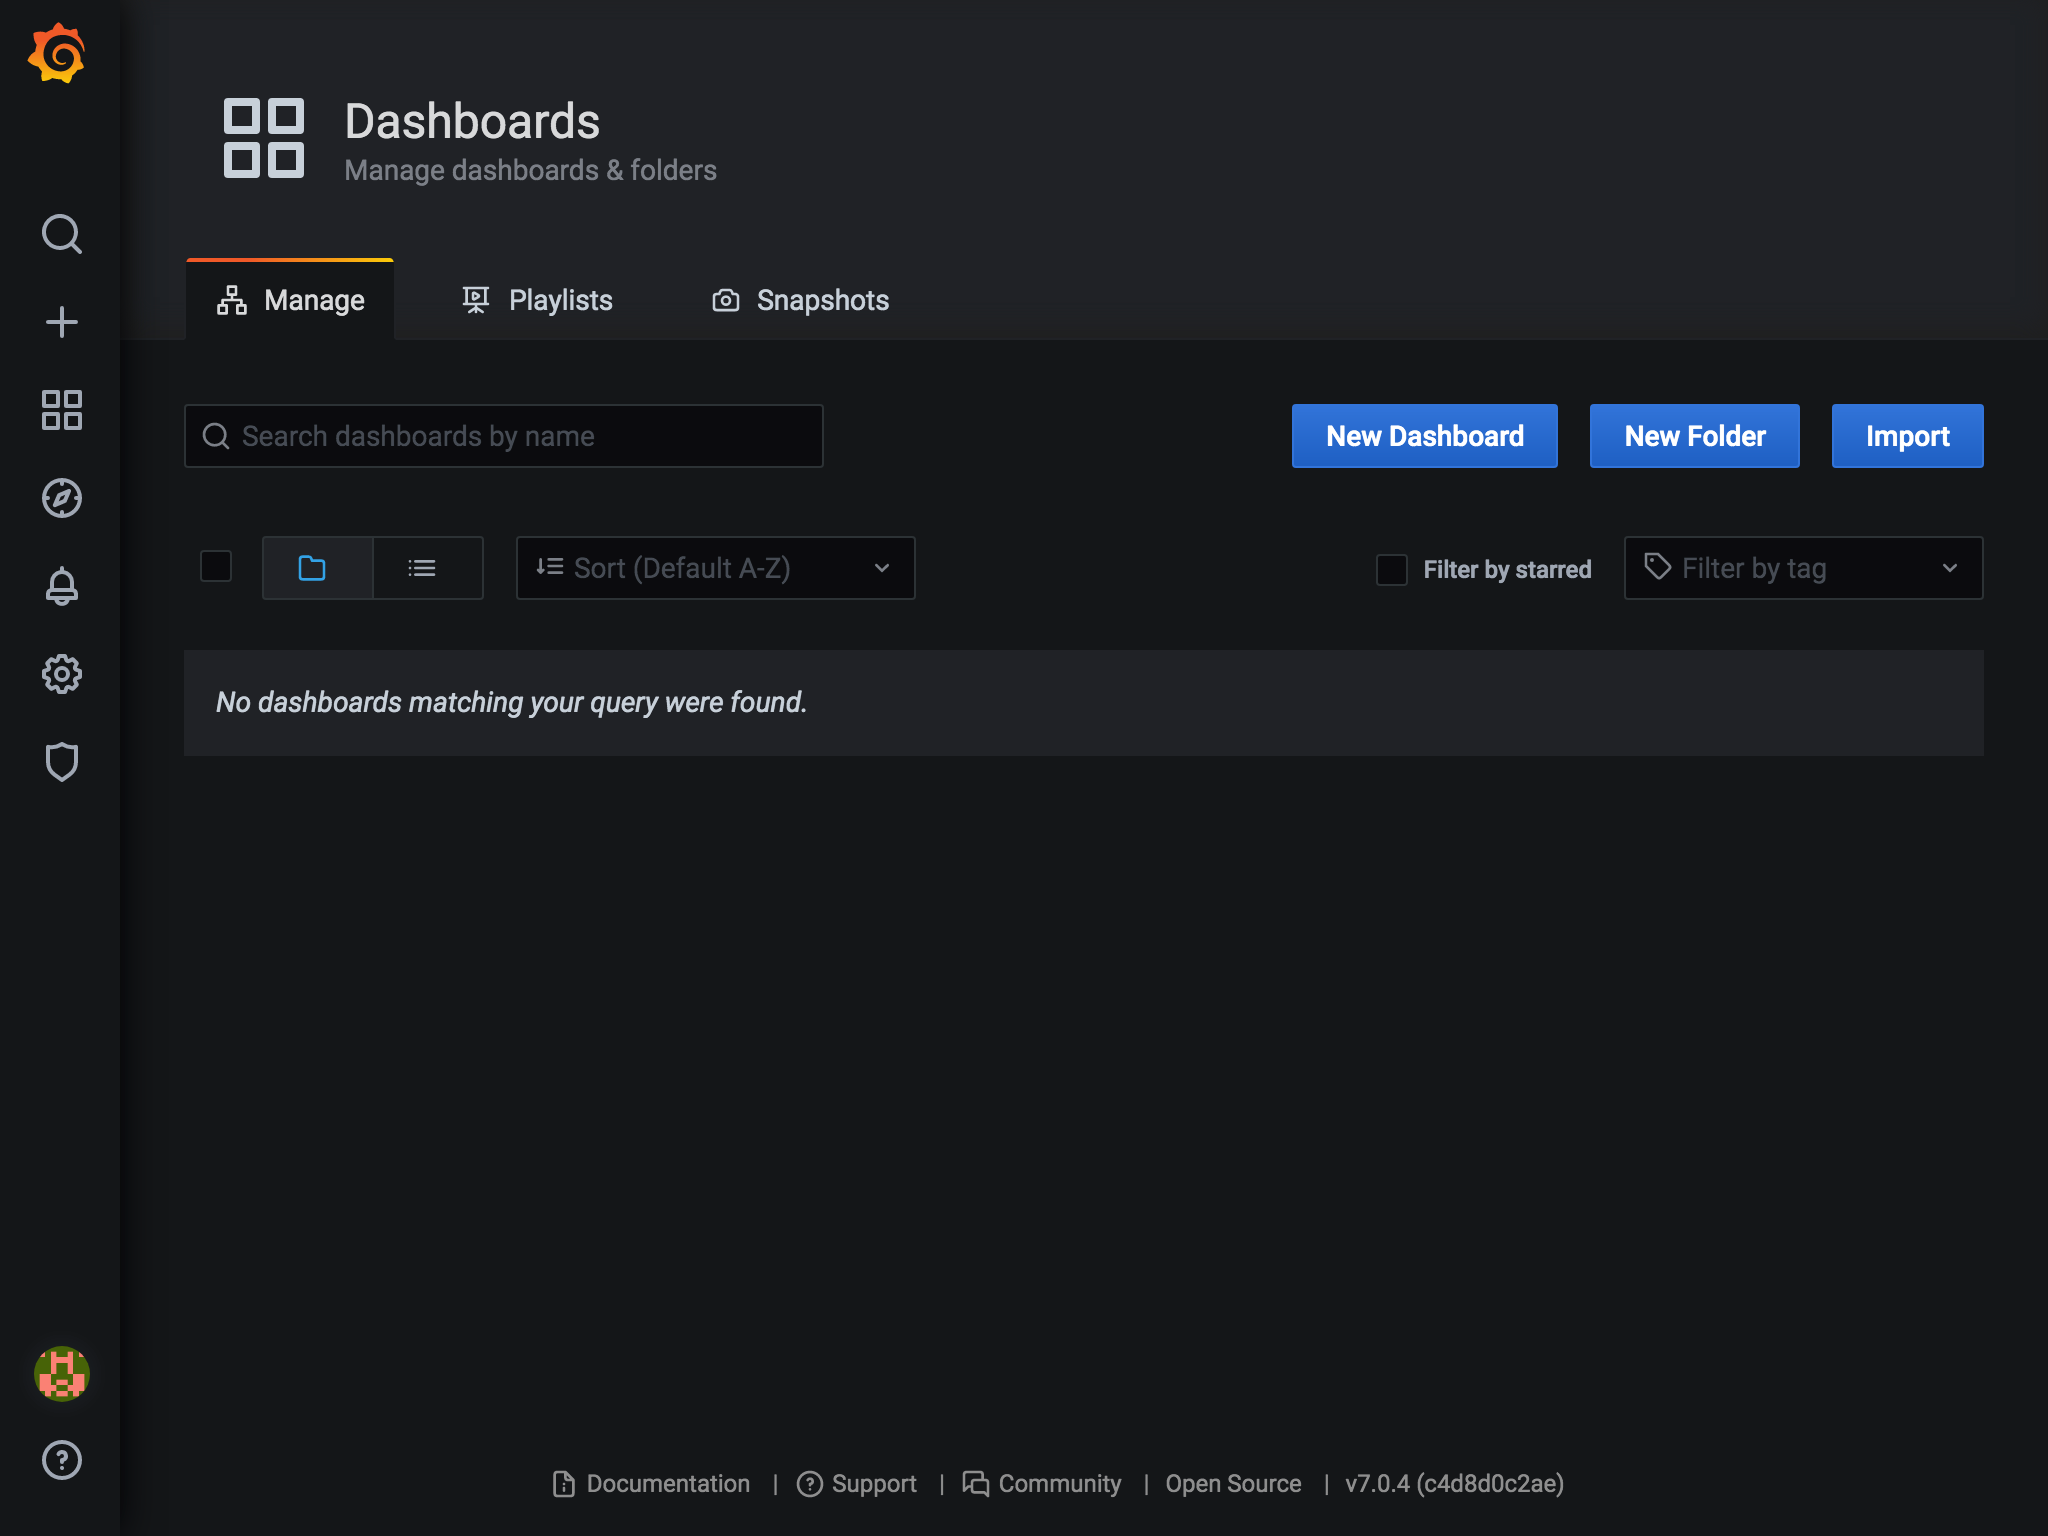
3. 画面中央の入力欄にID(今回は11074)を入力して、Loadボタンを押します。ダッシュボードにはそれぞれIDがあり、IDを登録することで、自分のGrafanaで使用することができます。

- ダッシュボードの情報が表示されます。
Prometheus Data Sourceのところで、データソースを選択し、画面下のImportボタンを押します。

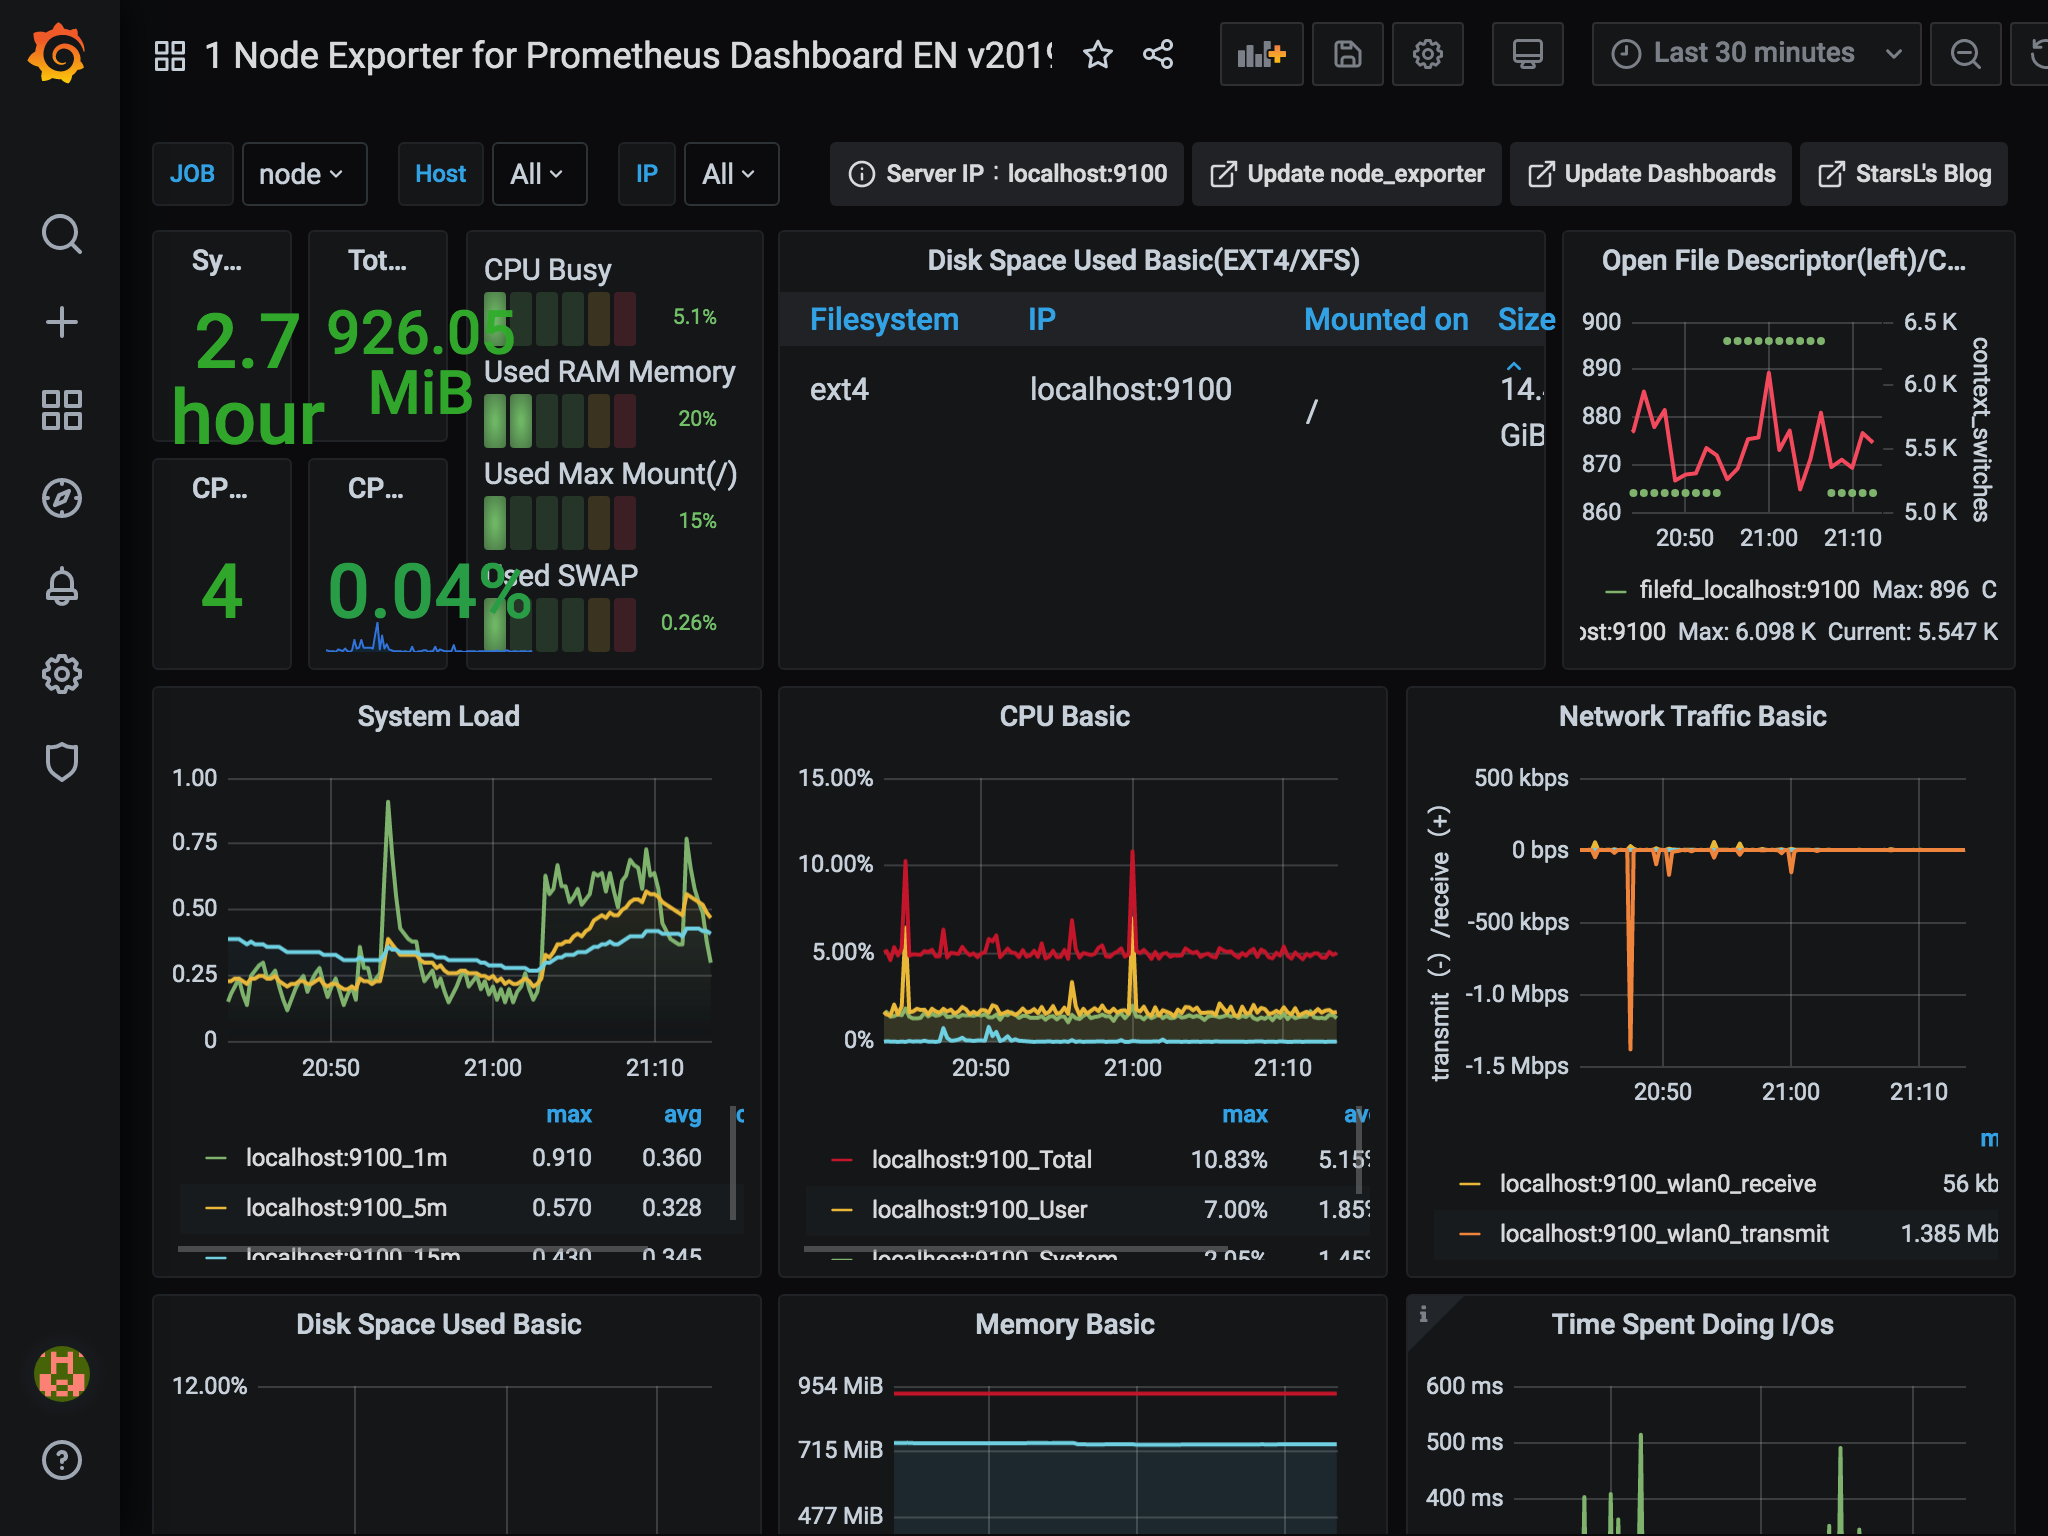
これでダッシュボードができました。すっげー。
CloudWatchの監視
GrafanaはデータソースとしてCloudWatchにも対応してます。
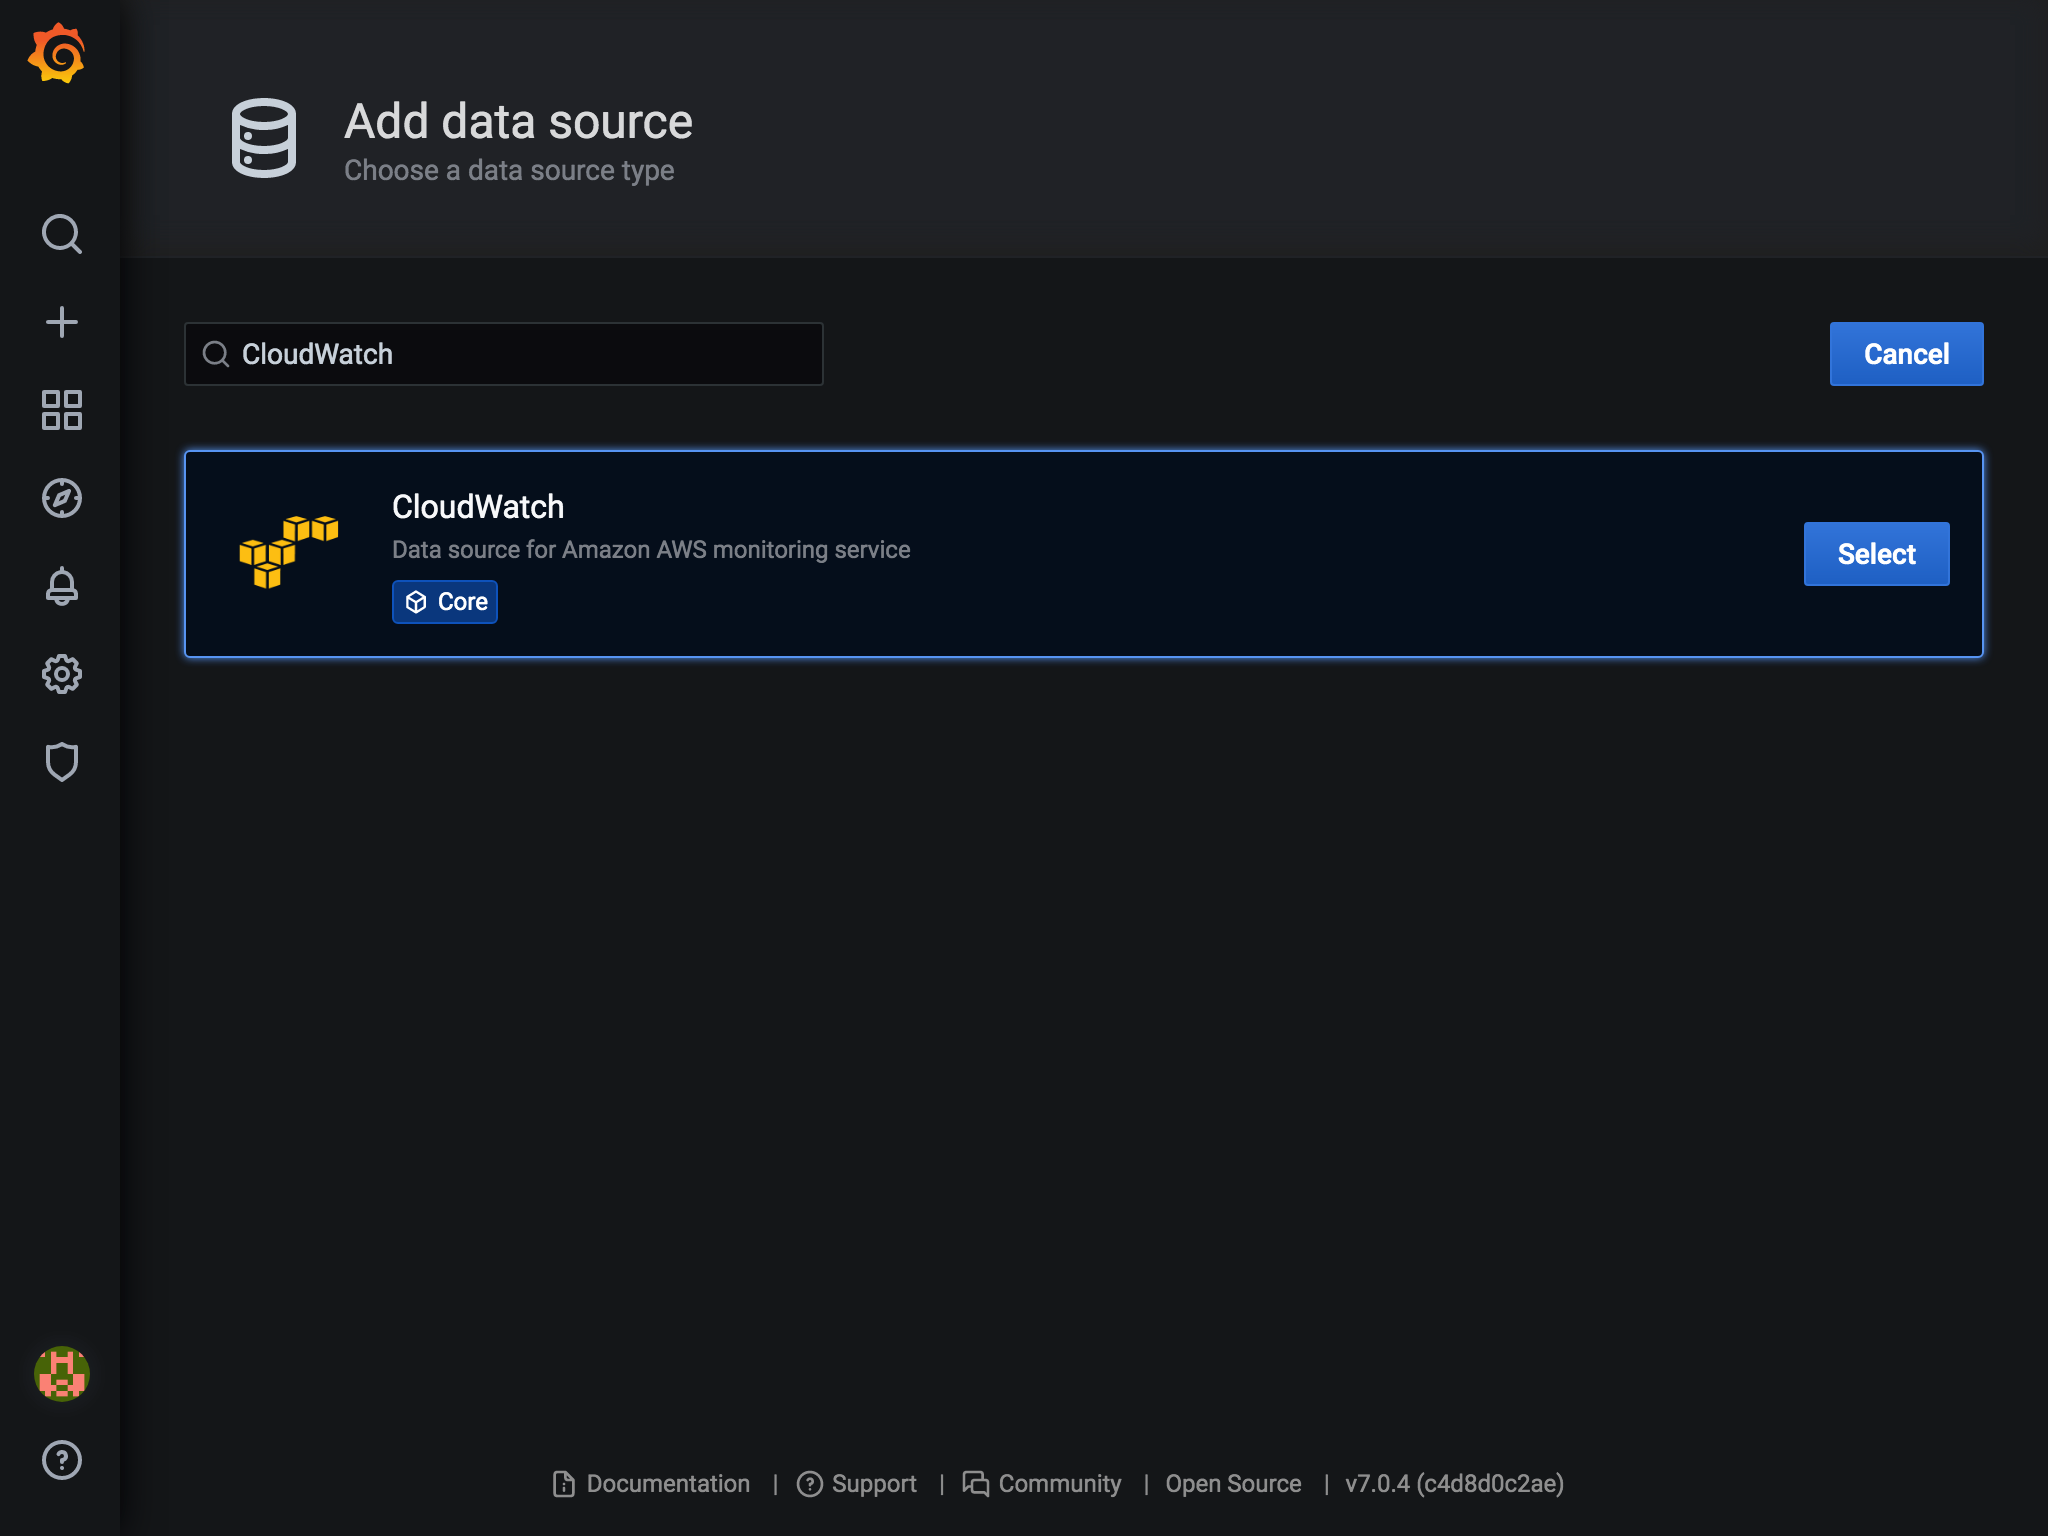
設定画面はこんな感じ
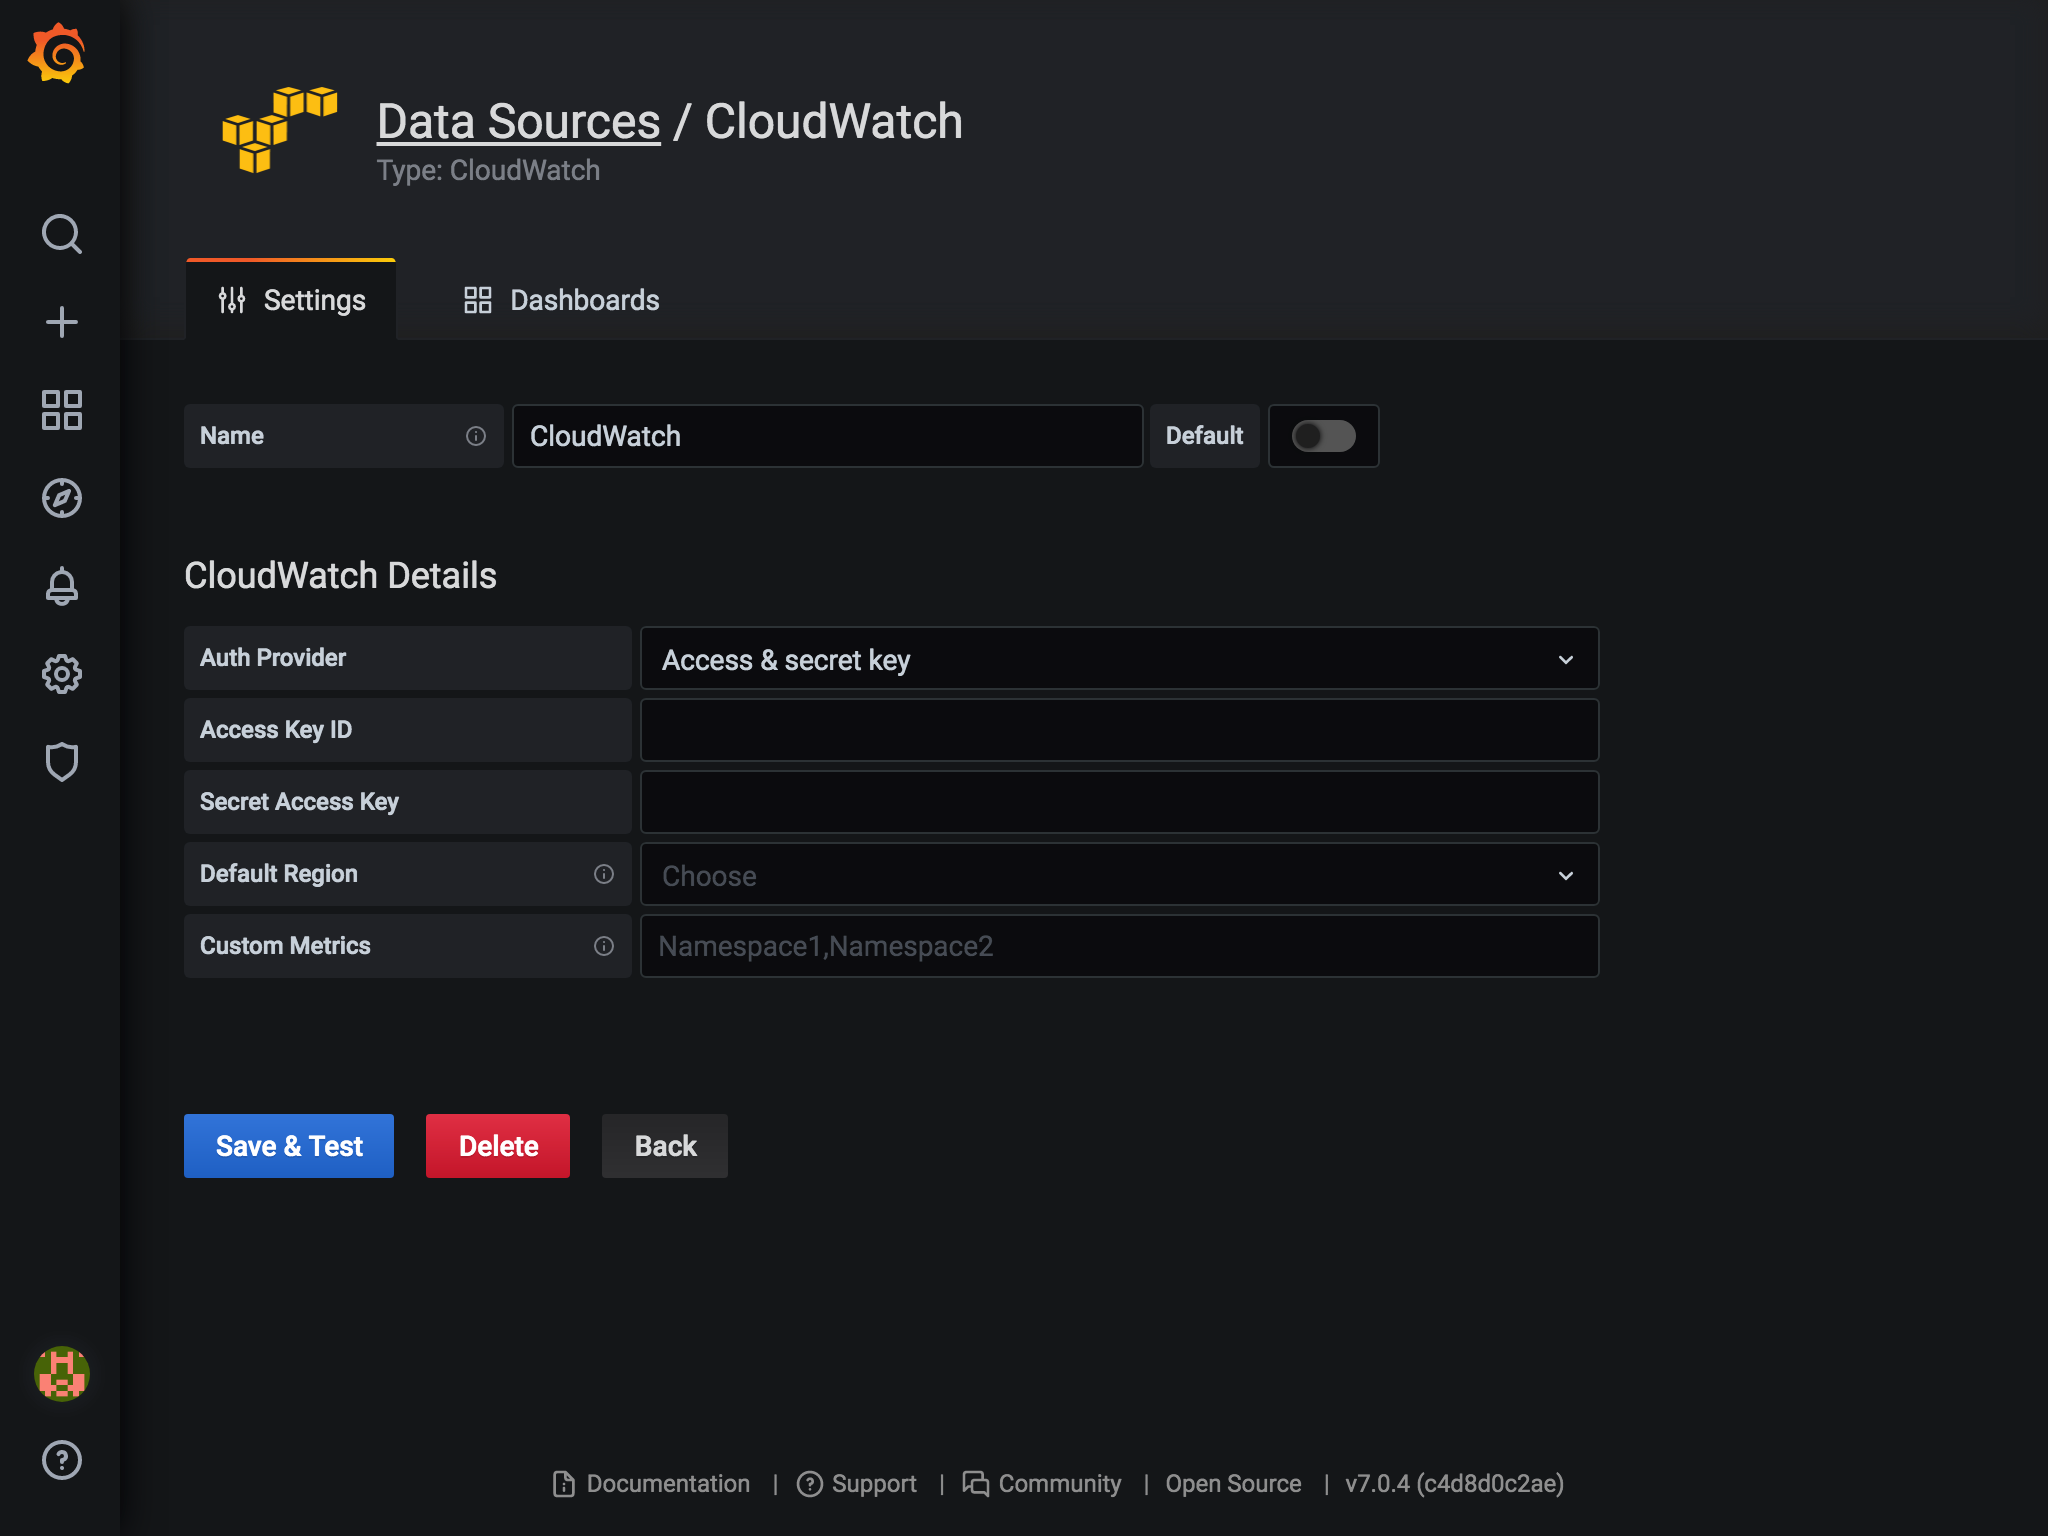
こちらもダッシュボードを検索して追加すれば、簡単に監視ができそうです。
(いい感じの監視対象がなかったのでキャプチャはありません。。。)
EC2のダッシュボードのリンクを貼っておきます。
https://grafana.com/grafana/dashboards/11265
