自分用メモ
plotちょっと表示されるのが小さいから
fig = plt.figure(dpi=150)
と書いておく。
すると大きく表示される。
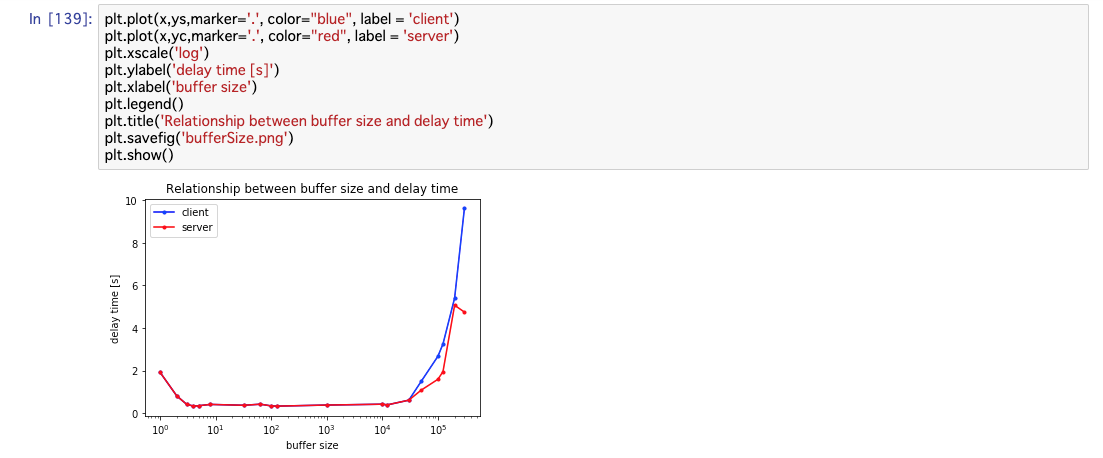
こんな感じのデフォルトサイズが
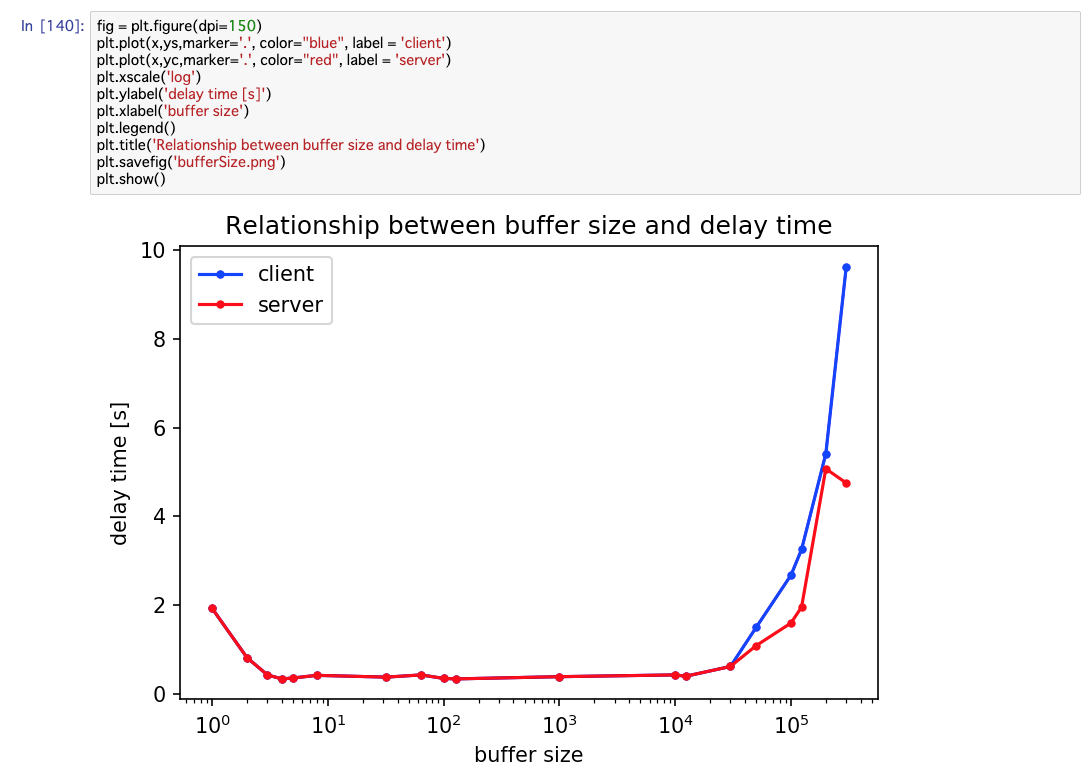
こんな感じに大きくなる
あと最後に
relaxed
plt.savefig('bifferSize.png')
plt.show()
って書けばローカルファイルに保存できる。
ここで
plt.show()
plt.savefig('bifferSize.png')
って感じに先にplt.show()してしまうと保存された画像が真っ白になってしまう。
もしplt.savefigがうまくいかない場合はこの順番が間違っている可能性がある。
![]()
![]()
![]()
![]()
![]()
![]()
![]()
![]()
![]()
![]()
今回のコード
import matplotlib
import matplotlib.pyplot as plt
fig = plt.figure(dpi=150)
plt.plot(x,ys,marker='.', color="blue", label = 'client')
plt.plot(x,yc,marker='.', color="red", label = 'server')
plt.xscale('log')
plt.ylabel('delay time [s]')
plt.xlabel('buffer size')
plt.legend()
plt.title('Relationship between buffer size and delay time')
plt.savefig('bufferSize.png')
plt.show()