前回の記事のちょっとした続きです。
今回の記事は実用的なコードというよりもアイデアの紹介になります。
前回のタイトルオチをひきずっています。
記事の背景
前回の記事でmatplotlibを簡潔に書く話を書きました。
もともとあきとしのスクラップノートさんの以下の記事に触発されて書いた記事でした。
[python] context manger を使ってmatplotlibの図を大量生産する
が、なんとコメント欄でご本人からコメントをいただきまして…!
そこで複数のグラフをシンプルに書く方法がないかという話になり、
自分のアイデアを整理してIssueに出したので、その内容を記事にもしておきます。
今回は実用性度外視で、アイデアを伝える最小限のコードに絞っています。
コンテキストマネージャでこういう書き方もできるんだな〜、
くらいに捉えていただければ。
要点
- fig,pltの処理とaxを設定する処理を分ける
- axの設定をクロージャに移譲する
- コンテキストマネージャにクラスではなく、関数を渡す
コード
import numpy as np
import matplotlib.pyplot as plt


class CorePlot():
    def __init__(self):
        self.fig = plt.figure(figsize=(5,3))

    def __enter__(self):
        return(self)

    def __exit__(self, exc_type, exc_value, exc_traceback):
        plt.show()


def plot(ax_func):
    cp = CorePlot()
    ax = cp.fig.add_subplot(111)

    ax = ax_func(ax)

    cp.ax = ax
    return cp


def multiplot(ax_funcs, indices):
    cp = CorePlot()
    axes = []

    for func, index in zip(ax_funcs, indices):
        ax = cp.fig.add_subplot(index)
        ax = func(ax)
        axes.append(ax)

    cp.axes = axes
    return cp


def set_ax(xlim:list[float]):
    # 今回は簡単のためxlimだけ設定する
    def _set_ax(ax):
        ax.set_xlim(*xlim)
        return ax

    return _set_ax

# 使用例
xx = np.linspace(-5,5,20)
yy = xx*xx

ax = set_ax(xlim=[0,5])

with plot(ax) as p:
    p.ax.plot(xx,yy)

ax0 = set_ax(xlim=[0,5])
ax1 = set_ax(xlim=[0,2])
ax2 = set_ax(xlim=[-5,0])

with multiplot([ax0, ax1, ax2],[221,222,223]) as p:
    p.axes[0].plot(xx,yy)
    p.axes[1].plot(xx,yy)
    p.axes[2].plot(xx,yy)
動かしてみる
まずは1つのグラフのplotから。
ax = set_ax(xlim=[0,5])

with plot(ax) as p:
    p.ax.plot(xx,yy)
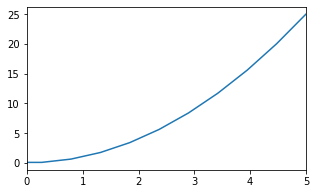
めちゃくちゃ簡素ですが、できてますね。
次に本題の複数のグラフの描画。
ax0 = set_ax(xlim=[0,5])
ax1 = set_ax(xlim=[0,2])
ax2 = set_ax(xlim=[-5,0])

with multiplot([ax0, ax1, ax2],[221,222,223]) as p:
    p.axes[0].plot(xx,yy)
    p.axes[1].plot(xx,yy)
    p.axes[2].plot(xx,yy)
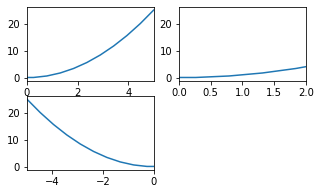
こちらもめちゃくちゃ簡素ですが、できてますね。
ただ、グラフごとに軸が表示されて見にくいですね…。
ここらへんはまだ詰めれてないのですが、
機会があればもう少し実用的なものも考えてみます。
まとめ
- 複数のグラフをシンプルに書くことができる(気がする)
- コンテキストマネージャは直接クラスを渡さなくても返り値がインスタンスならOK
だからwith open() as fとか書けるんですね〜