いつも記事を読んでいただきありがとうございます!
モブエンジニア(@mob-engineer)です!
情報としてちょっと古いですがRHEL10に関する技術検証について記事化してアウトプットしてみました。初見の方でもサクッと読めるように平易な表現で執筆しておりますので、お気軽にお読みいただければ幸いです。
目次
- 対象読者
- 記事のゴール
- RHEL10とは・できること
- AWS環境下での起動方法
- 構築手順
- 基本的な設定チェック
- まとめ
対象読者
次のような課題を抱えている方に本記事を役立てていただければ幸いです。
- RHEL10の機能についてざっくり知りたい方
- AWS環境でのRHEL10の挙動について知りたい方
記事のゴール
記事のゴールとして次のことを掲げています。
- RHEL10を通じてできるようになったことを知ってもらう
- AWS環境下でのRHEL10の挙動について知ってもらう
RHEL10とは・できること
2025.05.20にGA(一般公開)したRHEL(RedHad Enterprise Linux)の新バージョンとなります。
公式ドキュメントによると以下のような大きな変更がなされていると言及がありました。
AIエージェントによる設定支援は割とビックトピックになっていましたが、個人的にはOpenSSH バージョン 9.9 で提供したのが大きい印象ですね。
(耐量子暗号へのサポートが可能になったので)
公式ドキュメント・検証含めすべて完了しているわけではないですが廃止されている機能・削除されている機能もあるため、RHEL10を商用環境へサクッと導入できるかと言われたら、ちょっと難しい印象ですね。
廃止された機能・削除された機能は複数存在するため、検証前に必ずチェックしておくことを推奨します。(特にインストーラ回りは激しく変化しているようなので)
AWS環境下での起動方法
RHEL10が公開されましたが、ローカル環境で仮想サーバを構築⇒RHEL10をインストールするのもなかなか大変(+つまづきやすい)といった懸念もあると思います。
そのうえで、2025.05.30にAWS公式からAWS環境下でRHEL10を利用可能になったといったニュースリリースが公開されています。
個人的に、すごく早く対応しているのでさすがといった印象を持っています。
AWS環境下でのRHEL10サーバ構築方法として次の通りです。
構築手順
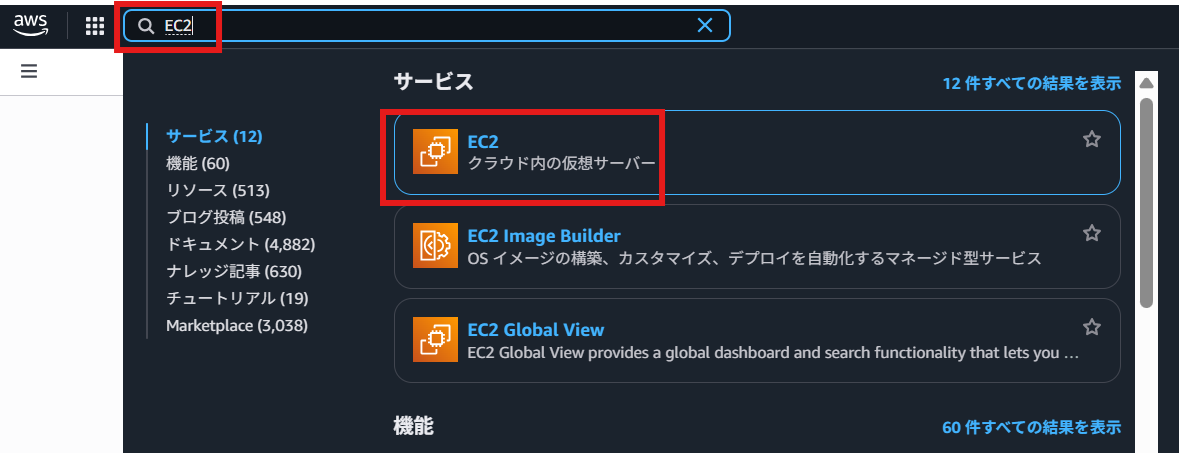
- AWSコンソール画面上部の検索ボックスにEC2と入力
- 検索結果からEC2をクリック
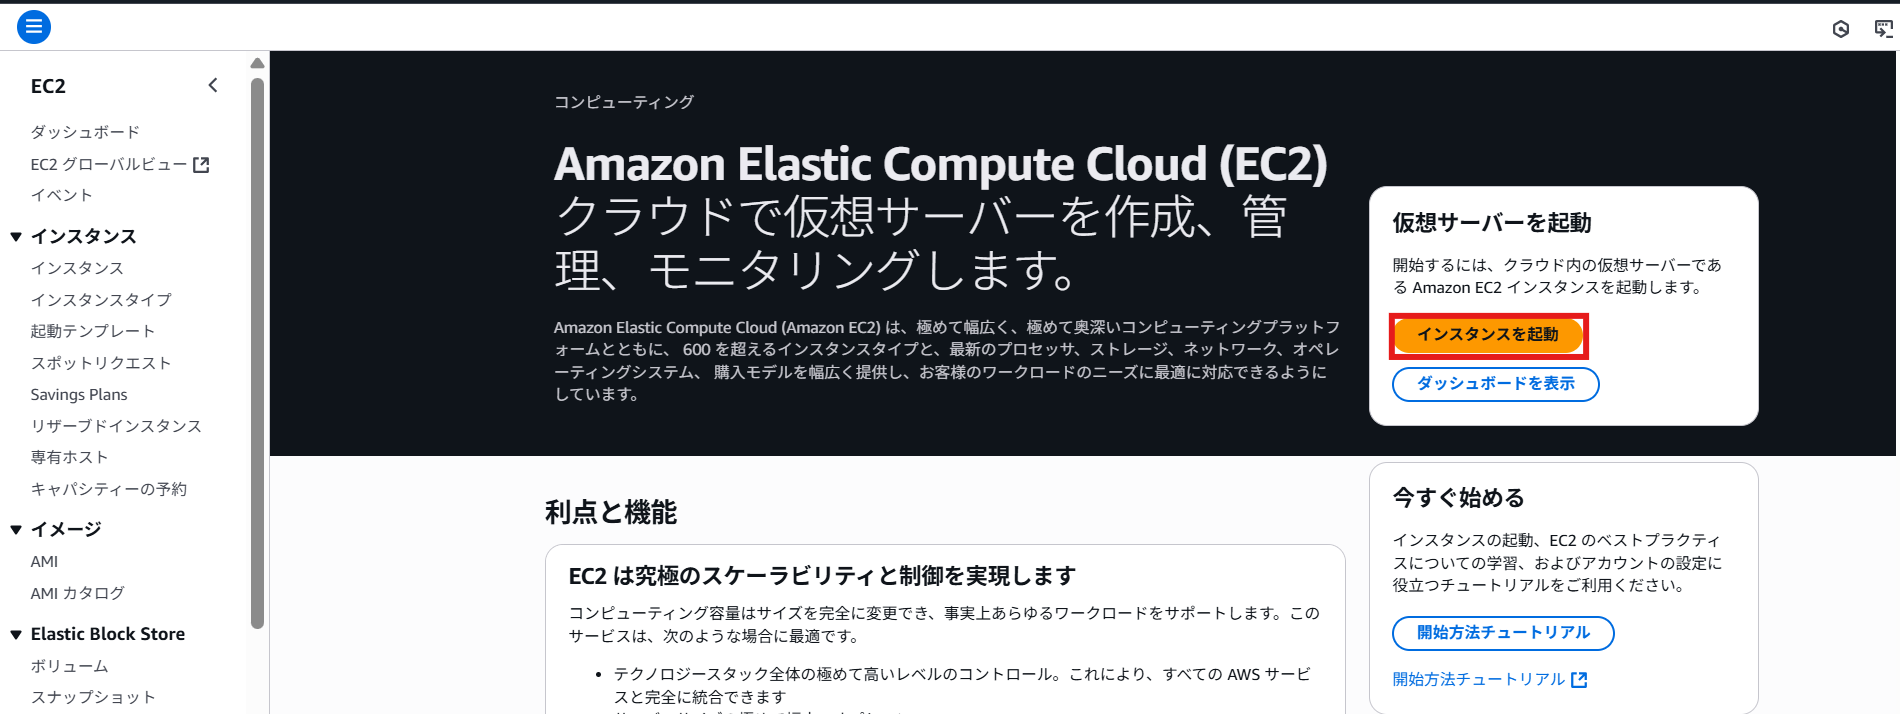
- 画面右側のインスタンスを起動ボタンをクリックします
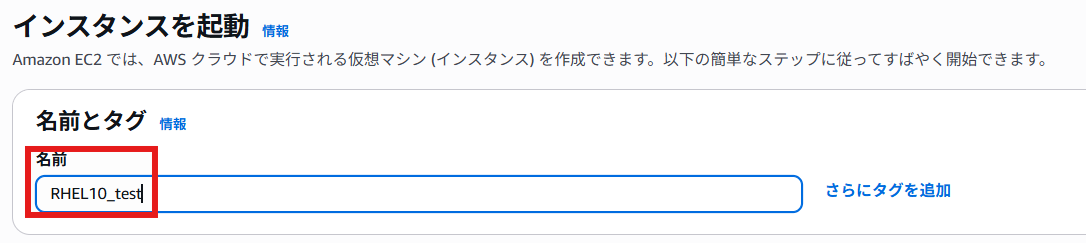
- 名前欄に任意の名前を入力します
- RedHatをクリックします
- マシンイメージがRedHat Enterprise Linux 10~になっていることを確認します

- キーペアを設定後、画面右側のインスタンスを起動ボタンをクリックします
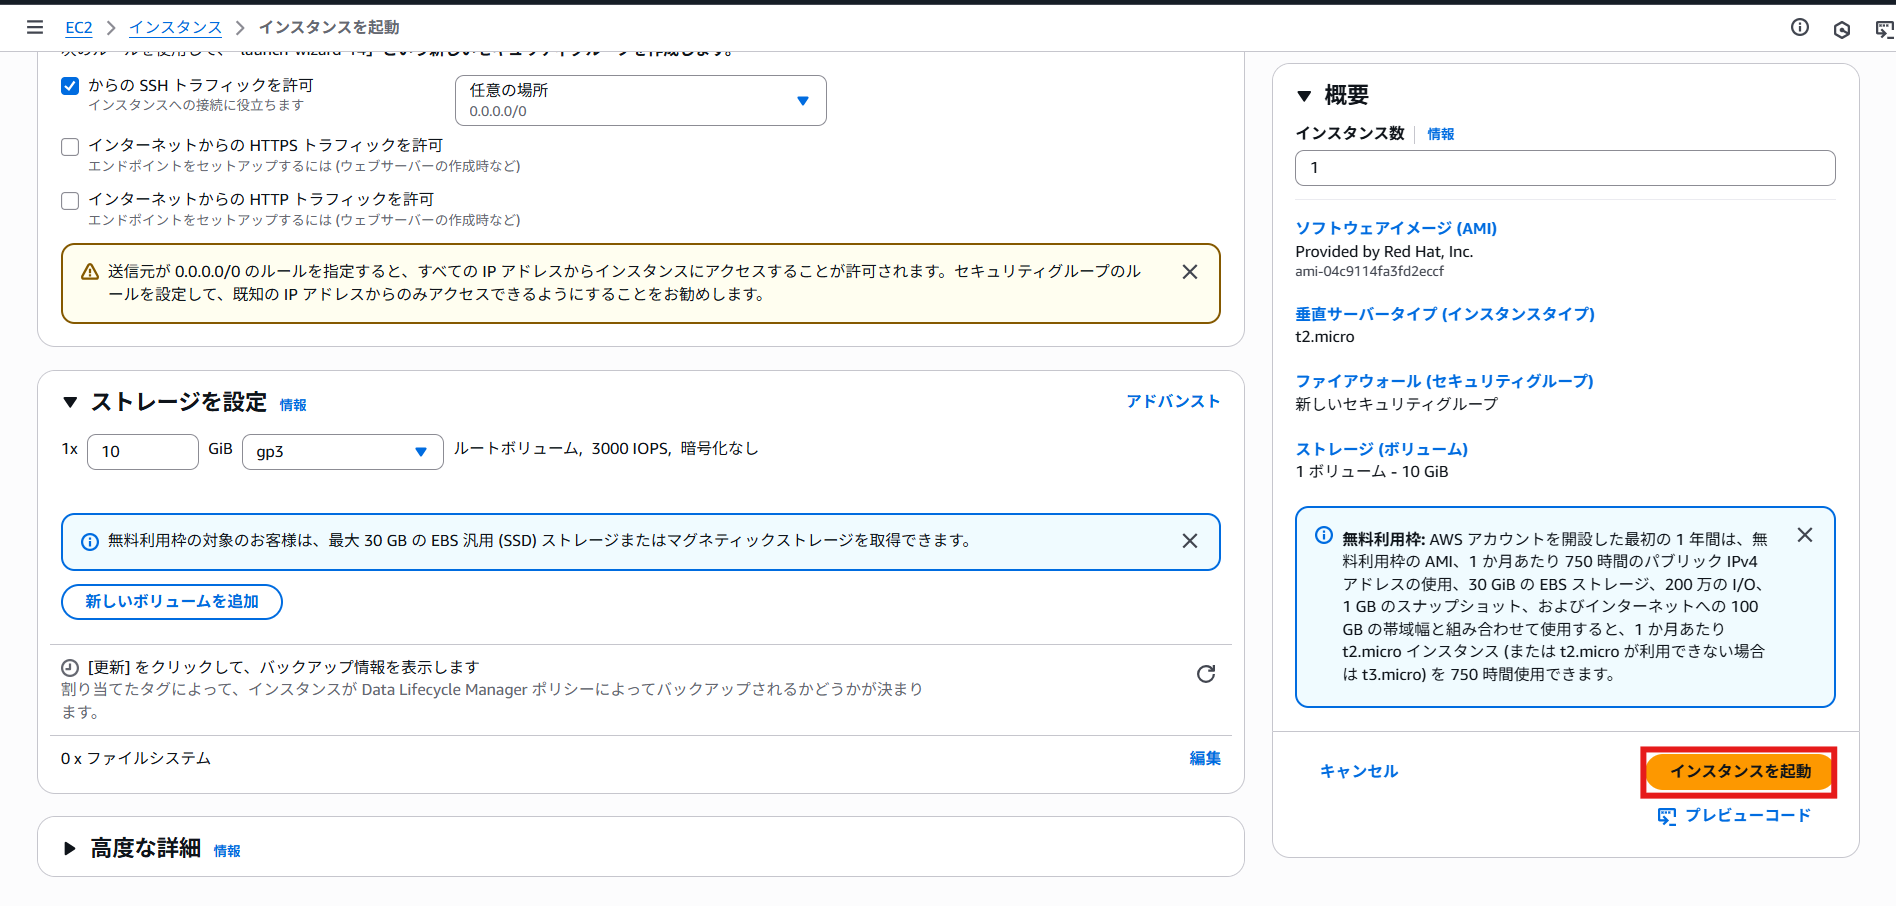
- 一定時間経過後、インスタンスの起動に成功しましたといったポップアップが表示されます

これで、RHEL10のEC2インスタンスの構築が完了しました。
基本的な設定チェック
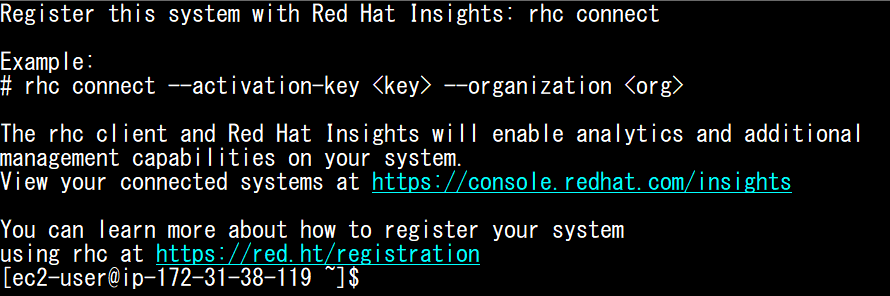
そのうえで、設定内容をチェックしたいのでインスタンスへ接続していくつかチェックしたいと思います。
ログイン時画面
実行結果
一つ一つ手作業でチェックするのがめんどくさかったのでClaudeさんにスクリプトを作成してもらいました。
作成スクリプト
#!/bin/bash

# RHEL9/RHEL10 システム一括チェックスクリプト
# 作成日: 2025/06/23

# 色設定
RED='\033[0;31m'
GREEN='\033[0;32m'
YELLOW='\033[1;33m'
BLUE='\033[0;34m'
PURPLE='\033[0;35m'
CYAN='\033[0;36m'
NC='\033[0m' # No Color

# ログファイル設定
LOGFILE="/tmp/rhel_system_check_$(date +%Y%m%d_%H%M%S).log"
ERRORLOG="/tmp/rhel_system_check_errors_$(date +%Y%m%d_%H%M%S).log"

# 関数定義
print_header() {
    echo -e "\n${BLUE}================================================${NC}"
    echo -e "${BLUE} $1 ${NC}"
    echo -e "${BLUE}================================================${NC}\n"
    echo "================================================" >> "$LOGFILE"
    echo " $1 " >> "$LOGFILE"
    echo "================================================" >> "$LOGFILE"
}

print_subheader() {
    echo -e "\n${CYAN}--- $1 ---${NC}"
    echo "--- $1 ---" >> "$LOGFILE"
}

execute_command() {
    local cmd="$1"
    local description="$2"

    echo -e "${YELLOW}実行中: ${NC}$description"
    echo "実行中: $description" >> "$LOGFILE"
    echo "コマンド: $cmd" >> "$LOGFILE"

    if eval "$cmd" >> "$LOGFILE" 2>> "$ERRORLOG"; then
        echo -e "${GREEN}✓ 完了${NC}"
        echo "" >> "$LOGFILE"
    else
        echo -e "${RED}✗ エラー (詳細: $ERRORLOG)${NC}"
        echo "エラー発生: $cmd" >> "$ERRORLOG"
        echo "" >> "$LOGFILE"
    fi
}

safe_execute() {
    local cmd="$1"
    local description="$2"

    if command -v $(echo "$cmd" | cut -d' ' -f1) >/dev/null 2>&1; then
        execute_command "$cmd" "$description"
    else
        echo -e "${YELLOW}⚠ スキップ: ${NC}$description (コマンドが見つかりません)"
        echo "スキップ: $description (コマンドが見つかりません)" >> "$LOGFILE"
    fi
}

# メインスクリプト開始
clear
echo -e "${PURPLE}RHEL9/RHEL10 システム一括チェックスクリプト${NC}"
echo -e "${PURPLE}実行日時: $(date)${NC}"
echo -e "${PURPLE}ログファイル: $LOGFILE${NC}"
echo -e "${PURPLE}エラーログ: $ERRORLOG${NC}\n"

# ログファイル初期化
echo "RHEL9/RHEL10 システム一括チェック" > "$LOGFILE"
echo "実行日時: $(date)" >> "$LOGFILE"
echo "" > "$ERRORLOG"

# 1. システム情報確認
print_header "システム情報確認"

print_subheader "OSバージョン・カーネル情報"
execute_command "cat /etc/redhat-release" "Red Hat リリース情報"
execute_command "hostnamectl" "ホスト情報"
safe_execute "lsb_release -a" "LSB情報"
execute_command "uname -r" "カーネルバージョン"
execute_command "uname -a" "システム詳細"
execute_command "cat /proc/version" "プロセッサ情報"
execute_command "systemctl --version" "systemdバージョン"
execute_command "rpm -qa | grep -E '^(kernel|glibc|systemd)' | sort" "主要パッケージ情報"

print_subheader "ハードウェア情報"
execute_command "lscpu" "CPU情報"
execute_command "cat /proc/cpuinfo | grep 'model name' | uniq" "CPUモデル"
execute_command "nproc" "CPU数"
execute_command "free -h" "メモリ情報"
execute_command "cat /proc/meminfo | head -20" "詳細メモリ情報"
safe_execute "lsmem" "メモリレイアウト"
execute_command "lsblk" "ブロックデバイス"
safe_execute "fdisk -l" "ディスク情報"
execute_command "df -h" "ディスク使用量"

# 2. ネットワーク設定確認
print_header "ネットワーク設定確認"

print_subheader "基本ネットワーク情報"
execute_command "ip addr show" "IPアドレス情報"
execute_command "ip link show" "ネットワークインターフェース"
safe_execute "nmcli device status" "NetworkManager デバイス状態"
safe_execute "nmcli connection show" "NetworkManager 接続情報"
execute_command "ip route show" "ルーティングテーブル"
safe_execute "netstat -rn" "ネットワーク統計"
execute_command "ss -tuln" "ソケット統計"

print_subheader "DNS・ホスト名設定"
execute_command "cat /etc/resolv.conf" "DNS設定"
safe_execute "systemd-resolve --status" "systemd-resolve 状態"
safe_execute "resolvectl status" "resolvectl 状態"
execute_command "hostname" "ホスト名"
execute_command "hostnamectl status" "ホスト詳細"
execute_command "cat /etc/hostname" "ホスト名ファイル"

# 3. ファイアウォール・セキュリティ
print_header "ファイアウォール・セキュリティ"

print_subheader "ファイアウォール設定"
execute_command "systemctl status firewalld" "firewalld 状態"
safe_execute "firewall-cmd --state" "ファイアウォール状態"
safe_execute "firewall-cmd --list-all" "ファイアウォール設定一覧"
safe_execute "firewall-cmd --list-services" "許可サービス一覧"
safe_execute "firewall-cmd --list-ports" "許可ポート一覧"
safe_execute "iptables -L -n" "iptables ルール"

print_subheader "SELinux設定"
safe_execute "getenforce" "SELinux 状態"
safe_execute "sestatus" "SELinux 詳細状態"
execute_command "cat /etc/selinux/config" "SELinux 設定ファイル"
safe_execute "semanage boolean -l | grep -E '(httpd|ssh|ftp)' | head -10" "SELinux ブール値サンプル"
safe_execute "getsebool -a | grep -E '(httpd|ssh|ftp)' | head -10" "SELinux ブール値確認"

# 4. ユーザー・グループ管理
print_header "ユーザー・グループ管理"

print_subheader "ユーザー情報"
execute_command "whoami" "現在のユーザー"
execute_command "id" "ユーザーID情報"
execute_command "groups" "所属グループ"
execute_command "cat /etc/passwd | grep -E ':(100[0-9]|[5-9][0-9]{2}):' | cut -d: -f1" "一般ユーザー一覧"
execute_command "getent passwd | grep -v nologin | grep -v false | head -10" "ログイン可能ユーザー"
safe_execute "sudo -l" "sudo 権限"
execute_command "ls -la /etc/sudoers.d/" "sudoers.d ディレクトリ"

print_subheader "グループ情報"
execute_command "cat /etc/group | head -20" "グループ情報(一部)"
execute_command "getent group | head -10" "グループエントリ"
execute_command "groups \$(whoami)" "現在ユーザーのグループ"

# 5. サービス・プロセス管理
print_header "サービス・プロセス管理"

print_subheader "systemd サービス"
execute_command "systemctl list-units --type=service --state=running | head -15" "実行中サービス"
execute_command "systemctl list-units --state=failed" "失敗したサービス"
execute_command "systemctl status sshd" "SSH サービス状態"
execute_command "systemctl status NetworkManager" "NetworkManager 状態"
execute_command "systemctl status firewalld" "firewalld 状態"
execute_command "systemctl status chronyd" "chronyd 状態"
execute_command "systemctl list-unit-files --type=service | grep enabled | head -15" "自動起動サービス"

print_subheader "プロセス確認"
execute_command "ps aux | head -15" "プロセス一覧"
execute_command "ps -ef | head -15" "プロセス詳細"
safe_execute "pstree | head -20" "プロセスツリー"
execute_command "uptime" "システム稼働時間"
safe_execute "vmstat 1 3" "仮想メモリ統計"

# 6. ログ管理
print_header "ログ管理"

print_subheader "systemd ログ"
execute_command "journalctl -b | tail -10" "ブートログ(最新10行)"
execute_command "journalctl -u sshd | tail -5" "SSH ログ(最新5行)"
execute_command "journalctl -p err | tail -5" "エラーログ(最新5行)"
execute_command "journalctl --disk-usage" "ジャーナルディスク使用量"
execute_command "cat /etc/systemd/journald.conf | grep -v '^#' | grep -v '^$'" "ジャーナル設定"

print_subheader "従来のログファイル"
execute_command "tail -5 /var/log/messages" "メッセージログ"
execute_command "tail -5 /var/log/secure" "セキュリティログ"
execute_command "ls -la /var/log/audit/" "監査ログディレクトリ"
execute_command "cat /etc/logrotate.conf | grep -v '^#' | grep -v '^$' | head -10" "ログローテーション設定"

# 7. パッケージ管理
print_header "パッケージ管理"

print_subheader "DNF/YUM コマンド"
execute_command "dnf list installed | wc -l" "インストール済みパッケージ数"
execute_command "dnf list installed | head -10" "インストール済みパッケージ(一部)"
execute_command "dnf repolist" "リポジトリ一覧"
execute_command "ls -la /etc/yum.repos.d/" "リポジトリ設定ファイル"
execute_command "dnf check-update | head -10" "アップデート可能パッケージ"
execute_command "dnf history | head -10" "DNF 履歴"

print_subheader "RPM コマンド"
execute_command "rpm -qa | wc -l" "RPMパッケージ総数"
execute_command "rpm -qa | head -10" "RPMパッケージ一覧(一部)"

# 8. 時刻同期・タイムゾーン
print_header "時刻同期・タイムゾーン"

execute_command "date" "現在時刻"
execute_command "timedatectl status" "時刻詳細"
execute_command "timedatectl list-timezones | grep Asia | head -10" "Asiaタイムゾーン"
execute_command "systemctl status chronyd" "chronyd 状態"
safe_execute "chrony sources -v" "chrony ソース"
safe_execute "chrony tracking" "chrony 追跡状態"

# 9. ストレージ・ファイルシステム
print_header "ストレージ・ファイルシステム"

execute_command "df -h" "ディスク使用量"
execute_command "du -sh /* 2>/dev/null | head -10" "ディレクトリサイズ"
execute_command "lsblk -f" "ファイルシステム情報"
execute_command "mount | grep -E '(ext4|xfs|btrfs)'" "マウント情報"
execute_command "cat /etc/fstab" "fstab設定"
safe_execute "findmnt | head -15" "マウントポイント"
safe_execute "pvs" "物理ボリューム"
safe_execute "vgs" "ボリュームグループ"
safe_execute "lvs" "論理ボリューム"

# 10. パフォーマンス・モニタリング
print_header "パフォーマンス・モニタリング"

execute_command "uptime" "システム負荷"
execute_command "w" "ログインユーザー"
execute_command "cat /proc/loadavg" "ロードアベレージ"
execute_command "cat /proc/meminfo | head -10" "メモリ詳細"
safe_execute "systemd-analyze" "起動時間分析"
safe_execute "systemd-analyze blame | head -10" "起動時間詳細"

# 11. RHEL10 特有の確認項目
print_header "RHEL10 特有の確認項目"

safe_execute "podman --version" "Podman バージョン"
safe_execute "podman system info | head -10" "Podman システム情報"
safe_execute "php --version" "PHP バージョン"
safe_execute "node --version" "Node.js バージョン"
safe_execute "npm --version" "npm バージョン"
execute_command "python3 --version" "Python バージョン"

# 12. 設定ファイル確認
print_header "設定ファイル確認"

execute_command "cat /etc/os-release" "OS リリース情報"
execute_command "cat /etc/machine-id" "マシンID"
execute_command "cat /etc/locale.conf" "ロケール設定"
execute_command "cat /etc/hosts" "hosts ファイル"
execute_command "cat /etc/nsswitch.conf | grep -v '^#'" "NSS設定"
execute_command "ls -la /etc/NetworkManager/system-connections/" "NetworkManager 接続設定"

# 13. ヘルスチェック
print_header "システムヘルスチェック"

execute_command "systemctl --failed" "失敗したサービス"
execute_command "journalctl -p err --since '1 hour ago' | wc -l" "過去1時間のエラー数"
execute_command "dmesg | tail -10" "カーネルメッセージ"
execute_command "ps aux --sort=-%cpu | head -5" "CPU使用率上位プロセス"
execute_command "ps aux --sort=-%mem | head -5" "メモリ使用率上位プロセス"
safe_execute "lsof | wc -l" "開いているファイル数"

# 完了メッセージ
print_header "チェック完了"
echo -e "${GREEN}✓ システムチェックが完了しました${NC}"
echo -e "${BLUE}詳細ログ: $LOGFILE${NC}"
echo -e "${BLUE}エラーログ: $ERRORLOG${NC}"

# ログファイルのサイズ確認
echo -e "\n${CYAN}ログファイル情報:${NC}"
ls -lh "$LOGFILE" "$ERRORLOG"

# エラー数の集計
error_count=$(wc -l < "$ERRORLOG")
if [ "$error_count" -gt 1 ]; then
    echo -e "${YELLOW}⚠ $error_count 件のエラーまたは警告が発生しました${NC}"
else
    echo -e "${GREEN}✓ エラーなしで完了しました${NC}"
fi

echo -e "\n${PURPLE}実行完了時刻: $(date)${NC}"
実行画面
RHEL9/RHEL10 システム一括チェックスクリプト
実行日時: Sun Jun 22 23:53:54 UTC 2025
ログファイル: /tmp/rhel_system_check_20250622_235354.log
エラーログ: /tmp/rhel_system_check_errors_20250622_235354.log


================================================
 システム情報確認
================================================


--- OSバージョン・カーネル情報 ---
実行中: Red Hat リリース情報
✓ 完了
実行中: ホスト情報
✓ 完了
⚠ スキップ: LSB情報 (コマンドが見つかりません)
実行中: カーネルバージョン
✓ 完了
実行中: システム詳細
✓ 完了
実行中: プロセッサ情報
✓ 完了
実行中: systemdバージョン
✓ 完了
実行中: 主要パッケージ情報
✓ 完了

--- ハードウェア情報 ---
実行中: CPU情報
✓ 完了
実行中: CPUモデル
✓ 完了
実行中: CPU数
✓ 完了
実行中: メモリ情報
✓ 完了
実行中: 詳細メモリ情報
✓ 完了
実行中: メモリレイアウト
✓ 完了
実行中: ブロックデバイス
✓ 完了
実行中: ディスク情報
✓ 完了
実行中: ディスク使用量
✓ 完了

================================================
 ネットワーク設定確認
================================================


--- 基本ネットワーク情報 ---
実行中: IPアドレス情報
✓ 完了
実行中: ネットワークインターフェース
✓ 完了
実行中: NetworkManager デバイス状態
✓ 完了
実行中: NetworkManager 接続情報
✓ 完了
実行中: ルーティングテーブル
✓ 完了
⚠ スキップ: ネットワーク統計 (コマンドが見つかりません)
実行中: ソケット統計
✓ 完了

--- DNS・ホスト名設定 ---
実行中: DNS設定
✓ 完了
⚠ スキップ: systemd-resolve 状態 (コマンドが見つかりません)
実行中: resolvectl 状態
✗ エラー (詳細: /tmp/rhel_system_check_errors_20250622_235354.log)
実行中: ホスト名
✓ 完了
実行中: ホスト詳細
✓ 完了
実行中: ホスト名ファイル
✓ 完了

================================================
 ファイアウォール・セキュリティ
================================================


--- ファイアウォール設定 ---
実行中: firewalld 状態
✗ エラー (詳細: /tmp/rhel_system_check_errors_20250622_235354.log)
⚠ スキップ: ファイアウォール状態 (コマンドが見つかりません)
⚠ スキップ: ファイアウォール設定一覧 (コマンドが見つかりません)
⚠ スキップ: 許可サービス一覧 (コマンドが見つかりません)
⚠ スキップ: 許可ポート一覧 (コマンドが見つかりません)
⚠ スキップ: iptables ルール (コマンドが見つかりません)

--- SELinux設定 ---
実行中: SELinux 状態
✓ 完了
実行中: SELinux 詳細状態
✓ 完了
実行中: SELinux 設定ファイル
✓ 完了
実行中: SELinux ブール値サンプル
✓ 完了
実行中: SELinux ブール値確認
✓ 完了

================================================
 ユーザー・グループ管理
================================================


--- ユーザー情報 ---
実行中: 現在のユーザー
✓ 完了
実行中: ユーザーID情報
✓ 完了
実行中: 所属グループ
✓ 完了
実行中: 一般ユーザー一覧
✓ 完了
実行中: ログイン可能ユーザー
✓ 完了
実行中: sudo 権限
✓ 完了
実行中: sudoers.d ディレクトリ
✓ 完了

--- グループ情報 ---
実行中: グループ情報(一部)
✓ 完了
実行中: グループエントリ
✓ 完了
実行中: 現在ユーザーのグループ
✓ 完了

================================================
 サービス・プロセス管理
================================================


--- systemd サービス ---
実行中: 実行中サービス
✓ 完了
実行中: 失敗したサービス
✓ 完了
実行中: SSH サービス状態
✓ 完了
実行中: NetworkManager 状態
✓ 完了
実行中: firewalld 状態
✗ エラー (詳細: /tmp/rhel_system_check_errors_20250622_235354.log)
実行中: chronyd 状態
✓ 完了
実行中: 自動起動サービス
✓ 完了

--- プロセス確認 ---
実行中: プロセス一覧
✓ 完了
実行中: プロセス詳細
✓ 完了
実行中: プロセスツリー
✓ 完了
実行中: システム稼働時間
✓ 完了
実行中: 仮想メモリ統計
✓ 完了

================================================
 ログ管理
================================================


--- systemd ログ ---
実行中: ブートログ(最新10行)
✓ 完了
実行中: SSH ログ(最新5行)
✓ 完了
実行中: エラーログ(最新5行)
✓ 完了
実行中: ジャーナルディスク使用量
✓ 完了
実行中: ジャーナル設定
✗ エラー (詳細: /tmp/rhel_system_check_errors_20250622_235354.log)

--- 従来のログファイル ---
実行中: メッセージログ
✓ 完了
実行中: セキュリティログ
✓ 完了
実行中: 監査ログディレクトリ
✓ 完了
実行中: ログローテーション設定
✓ 完了

================================================
 パッケージ管理
================================================


--- DNF/YUM コマンド ---
実行中: インストール済みパッケージ数
✓ 完了
実行中: インストール済みパッケージ(一部)
✓ 完了
実行中: リポジトリ一覧
✓ 完了
実行中: リポジトリ設定ファイル
✓ 完了
実行中: アップデート可能パッケージ
✓ 完了
実行中: DNF 履歴
✓ 完了

--- RPM コマンド ---
実行中: RPMパッケージ総数
✓ 完了
実行中: RPMパッケージ一覧(一部)
✓ 完了

================================================
 時刻同期・タイムゾーン
================================================

実行中: 現在時刻
✓ 完了
実行中: 時刻詳細
✓ 完了
実行中: Asiaタイムゾーン
✓ 完了
実行中: chronyd 状態
✓ 完了
⚠ スキップ: chrony ソース (コマンドが見つかりません)
⚠ スキップ: chrony 追跡状態 (コマンドが見つかりません)

================================================
 ストレージ・ファイルシステム
================================================

実行中: ディスク使用量
✓ 完了
実行中: ディレクトリサイズ
✓ 完了
実行中: ファイルシステム情報
✓ 完了
実行中: マウント情報
✓ 完了
実行中: fstab設定
✓ 完了
実行中: マウントポイント
✓ 完了
実行中: 物理ボリューム
✓ 完了
実行中: ボリュームグループ
✓ 完了
実行中: 論理ボリューム
✓ 完了

================================================
 パフォーマンス・モニタリング
================================================

実行中: システム負荷
✓ 完了
実行中: ログインユーザー
✓ 完了
実行中: ロードアベレージ
✓ 完了
実行中: メモリ詳細
✓ 完了
実行中: 起動時間分析
✓ 完了
実行中: 起動時間詳細
✓ 完了

================================================
 RHEL10 特有の確認項目
================================================

⚠ スキップ: Podman バージョン (コマンドが見つかりません)
⚠ スキップ: Podman システム情報 (コマンドが見つかりません)
⚠ スキップ: PHP バージョン (コマンドが見つかりません)
⚠ スキップ: Node.js バージョン (コマンドが見つかりません)
⚠ スキップ: npm バージョン (コマンドが見つかりません)
実行中: Python バージョン
✓ 完了

================================================
 設定ファイル確認
================================================

実行中: OS リリース情報
✓ 完了
実行中: マシンID
✓ 完了
実行中: ロケール設定
✓ 完了
実行中: hosts ファイル
✓ 完了
実行中: NSS設定
✓ 完了
実行中: NetworkManager 接続設定
✓ 完了

================================================
 システムヘルスチェック
================================================

実行中: 失敗したサービス
✓ 完了
実行中: 過去1時間のエラー数
✓ 完了
実行中: カーネルメッセージ
✓ 完了
実行中: CPU使用率上位プロセス
✓ 完了
実行中: メモリ使用率上位プロセス
✓ 完了
⚠ スキップ: 開いているファイル数 (コマンドが見つかりません)

================================================
 チェック完了
================================================

✓ システムチェックが完了しました
詳細ログ: /tmp/rhel_system_check_20250622_235354.log
エラーログ: /tmp/rhel_system_check_errors_20250622_235354.log

ログファイル情報:
-rw-r--r--. 1 root root 52K Jun 22 23:54 /tmp/rhel_system_check_20250622_235354.log
-rw-r--r--. 1 root root 402 Jun 22 23:53 /tmp/rhel_system_check_errors_20250622_235354.log
⚠ 9 件のエラーまたは警告が発生しました

実行完了時刻: Sun Jun 22 23:54:05 UTC 2025
ログ
RHEL9/RHEL10 システム一括チェック
実行日時: Sun Jun 22 23:53:54 UTC 2025
================================================
システム情報確認
================================================
--- OSバージョン・カーネル情報 ---
実行中: Red Hat リリース情報
コマンド: cat /etc/redhat-release
Red Hat Enterprise Linux release 10.0 (Coughlan)
実行中: ホスト情報
コマンド: hostnamectl
Static hostname: ip-172-31-38-119.ap-northeast-1.compute.internal
Icon name: computer-vm
Chassis: vm 🖴
Machine ID: ec27b13248f62a5414bbe980ae044bc7
Boot ID: 5d02018d455247fdb23af4083431d986
Product UUID: ec27b132-48f6-2a54-14bb-e980ae044bc7
Virtualization: xen
Operating System: Red Hat Enterprise Linux 10.0 (Coughlan)
CPE OS Name: cpe:/o:redhat:enterprise_linux:10::baseos
Kernel: Linux 6.12.0-55.9.1.el10_0.x86_64
Architecture: x86-64
Hardware Vendor: Xen
Hardware Model: HVM domU
Hardware Serial: ec27b132-48f6-2a54-14bb-e980ae044bc7
Firmware Version: 4.11.amazon
Firmware Date: Thu 2006-08-24
Firmware Age: 18y 9month 4w 1d
スキップ: LSB情報 (コマンドが見つかりません)
実行中: カーネルバージョン
コマンド: uname -r
6.12.0-55.9.1.el10_0.x86_64
実行中: システム詳細
コマンド: uname -a
Linux ip-172-31-38-119.ap-northeast-1.compute.internal 6.12.0-55.9.1.el10_0.x86_64 #1 SMP PREEMPT_DYNAMIC Tue Mar 25 09:14:09 EDT 2025 x86_64 GNU/Linux
実行中: プロセッサ情報
コマンド: cat /proc/version
Linux version 6.12.0-55.9.1.el10_0.x86_64 (mockbuild@d9479e82fd7a4a249c8265aa7a184d55) (gcc (GCC) 14.2.1 20250110 (Red Hat 14.2.1-7), GNU ld version 2.41-53.el10) #1 SMP PREEMPT_DYNAMIC Tue Mar 25 09:14:09 EDT 2025
実行中: systemdバージョン
コマンド: systemctl --version
systemd 257 (257-9.el10_0.1-g8cd5633)
+PAM +AUDIT +SELINUX -APPARMOR +IMA +IPE +SMACK +SECCOMP -GCRYPT -GNUTLS +OPENSSL +ACL +BLKID +CURL +ELFUTILS +FIDO2 +IDN2 -IDN -IPTC +KMOD +LIBCRYPTSETUP +LIBCRYPTSETUP_PLUGINS +LIBFDISK +PCRE2 +PWQUALITY +P11KIT -QRENCODE +TPM2 +BZIP2 +LZ4 +XZ +ZLIB +ZSTD +BPF_FRAMEWORK +BTF +XKBCOMMON +UTMP +SYSVINIT +LIBARCHIVE
実行中: 主要パッケージ情報
コマンド: rpm -qa | grep -E '^(kernel|glibc|systemd)' | sort
glibc-2.39-37.el10.x86_64
glibc-common-2.39-37.el10.x86_64
glibc-gconv-extra-2.39-37.el10.x86_64
glibc-langpack-en-2.39-37.el10.x86_64
kernel-6.12.0-55.9.1.el10_0.x86_64
kernel-core-6.12.0-55.9.1.el10_0.x86_64
kernel-modules-6.12.0-55.9.1.el10_0.x86_64
kernel-modules-core-6.12.0-55.9.1.el10_0.x86_64
kernel-tools-6.12.0-55.9.1.el10_0.x86_64
kernel-tools-libs-6.12.0-55.9.1.el10_0.x86_64
systemd-257-9.el10_0.1.x86_64
systemd-libs-257-9.el10_0.1.x86_64
systemd-pam-257-9.el10_0.1.x86_64
systemd-udev-257-9.el10_0.1.x86_64
--- ハードウェア情報 ---
実行中: CPU情報
コマンド: lscpu
Architecture: x86_64
CPU op-mode(s): 32-bit, 64-bit
Address sizes: 46 bits physical, 48 bits virtual
Byte Order: Little Endian
CPU(s): 1
On-line CPU(s) list: 0
Vendor ID: GenuineIntel
BIOS Vendor ID: Intel
Model name: Intel(R) Xeon(R) CPU E5-2686 v4 @ 2.30GHz
BIOS Model name: CPU @ 2.3GHz
BIOS CPU family: 1
CPU family: 6
Model: 79
Thread(s) per core: 1
Core(s) per socket: 1
Socket(s): 1
Stepping: 1
BogoMIPS: 4600.02
Flags: fpu vme de pse tsc msr pae mce cx8 apic sep mtrr pge mca cmov pat pse36 clflush mmx fxsr sse sse2 ht syscall nx rdtscp lm constant_tsc rep_good nopl xtopology cpuid tsc_known_freq pni pclmulqdq ssse3 fma cx16 pcid sse4_1 sse4_2 x2apic movbe popcnt tsc_deadline_timer aes xsave avx f16c rdrand hypervisor lahf_lm abm cpuid_fault pti fsgsbase bmi1 avx2 smep bmi2 erms invpcid xsaveopt
Hypervisor vendor: Xen
Virtualization type: full
L1d cache: 32 KiB (1 instance)
L1i cache: 32 KiB (1 instance)
L2 cache: 256 KiB (1 instance)
L3 cache: 45 MiB (1 instance)
NUMA node(s): 1
NUMA node0 CPU(s): 0
Vulnerability Gather data sampling: Not affected
Vulnerability Itlb multihit: KVM: Mitigation: VMX unsupported
Vulnerability L1tf: Mitigation; PTE Inversion
Vulnerability Mds: Vulnerable: Clear CPU buffers attempted, no microcode; SMT Host state unknown
Vulnerability Meltdown: Mitigation; PTI
Vulnerability Mmio stale data: Vulnerable: Clear CPU buffers attempted, no microcode; SMT Host state unknown
Vulnerability Reg file data sampling: Not affected
Vulnerability Retbleed: Not affected
Vulnerability Spec rstack overflow: Not affected
Vulnerability Spec store bypass: Vulnerable
Vulnerability Spectre v1: Mitigation; usercopy/swapgs barriers and __user pointer sanitization
Vulnerability Spectre v2: Mitigation; Retpolines; STIBP disabled; RSB filling; PBRSB-eIBRS Not affected; BHI Retpoline
Vulnerability Srbds: Not affected
Vulnerability Tsx async abort: Not affected
実行中: CPUモデル
コマンド: cat /proc/cpuinfo | grep 'model name' | uniq
model name : Intel(R) Xeon(R) CPU E5-2686 v4 @ 2.30GHz
実行中: CPU数
コマンド: nproc
1
実行中: メモリ情報
コマンド: free -h
total used free shared buff/cache available
Mem: 951Mi 313Mi 558Mi 5.1Mi 216Mi 637Mi
Swap: 0B 0B 0B
実行中: 詳細メモリ情報
コマンド: cat /proc/meminfo | head -20
MemTotal: 974192 kB
MemFree: 572196 kB
MemAvailable: 653268 kB
Buffers: 2928 kB
Cached: 202448 kB
SwapCached: 0 kB
Active: 187000 kB
Inactive: 95408 kB
Active(anon): 82156 kB
Inactive(anon): 0 kB
Active(file): 104844 kB
Inactive(file): 95408 kB
Unevictable: 1536 kB
Mlocked: 0 kB
SwapTotal: 0 kB
SwapFree: 0 kB
Zswap: 0 kB
Zswapped: 0 kB
Dirty: 24 kB
Writeback: 0 kB
実行中: メモリレイアウト
コマンド: lsmem
RANGE SIZE STATE REMOVABLE BLOCK
0x0000000000000000-0x000000003fffffff 1G online yes 0-7
Memory block size: 128M
Total online memory: 1G
Total offline memory: 0B
実行中: ブロックデバイス
コマンド: lsblk
NAME MAJ:MIN RM SIZE RO TYPE MOUNTPOINTS
xvda 202:0 0 10G 0 disk
├─xvda1 202:1 0 1M 0 part
├─xvda2 202:2 0 200M 0 part /boot/efi
└─xvda3 202:3 0 9.8G 0 part /
実行中: ディスク情報
コマンド: fdisk -l
Disk /dev/xvda: 10 GiB, 10737418240 bytes, 20971520 sectors
Units: sectors of 1 * 512 = 512 bytes
Sector size (logical/physical): 512 bytes / 512 bytes
I/O size (minimum/optimal): 512 bytes / 512 bytes
Disklabel type: gpt
Disk identifier: D209C89E-EA5E-4FBD-B161-B461CCE297E0
Device Start End Sectors Size Type
/dev/xvda1 2048 4095 2048 1M BIOS boot
/dev/xvda2 4096 413695 409600 200M EFI System
/dev/xvda3 413696 20971486 20557791 9.8G Linux filesystem
実行中: ディスク使用量
コマンド: df -h
Filesystem Size Used Avail Use% Mounted on
/dev/xvda3 9.8G 1.6G 8.3G 16% /
devtmpfs 4.0M 0 4.0M 0% /dev
tmpfs 476M 0 476M 0% /dev/shm
tmpfs 191M 3.6M 187M 2% /run
tmpfs 1.0M 0 1.0M 0% /run/credentials/systemd-journald.service
/dev/xvda2 200M 8.4M 192M 5% /boot/efi
tmpfs 1.0M 0 1.0M 0% /run/credentials/getty@tty1.service
tmpfs 1.0M 0 1.0M 0% /run/credentials/serial-getty@ttyS0.service
tmpfs 96M 4.0K 96M 1% /run/user/1000
================================================
ネットワーク設定確認
================================================
--- 基本ネットワーク情報 ---
実行中: IPアドレス情報
コマンド: ip addr show
1: lo: <LOOPBACK,UP,LOWER_UP> mtu 65536 qdisc noqueue state UNKNOWN group default qlen 1000
link/loopback 00:00:00:00:00:00 brd 00:00:00:00:00:00
inet 127.0.0.1/8 scope host lo
valid_lft forever preferred_lft forever
inet6 ::1/128 scope host noprefixroute
valid_lft forever preferred_lft forever
2: enX0: <BROADCAST,MULTICAST,UP,LOWER_UP> mtu 9001 qdisc fq_codel state UP group default qlen 1000
link/ether 06:21:fc:b8:88:eb brd ff:ff:ff:ff:ff:ff
altname enx0621fcb888eb
inet 172.31.38.119/20 brd 172.31.47.255 scope global dynamic noprefixroute enX0
valid_lft 2986sec preferred_lft 2986sec
inet6 fe80::421:fcff:feb8:88eb/64 scope link noprefixroute
valid_lft forever preferred_lft forever
実行中: ネットワークインターフェース
コマンド: ip link show
1: lo: <LOOPBACK,UP,LOWER_UP> mtu 65536 qdisc noqueue state UNKNOWN mode DEFAULT group default qlen 1000
link/loopback 00:00:00:00:00:00 brd 00:00:00:00:00:00
2: enX0: <BROADCAST,MULTICAST,UP,LOWER_UP> mtu 9001 qdisc fq_codel state UP mode DEFAULT group default qlen 1000
link/ether 06:21:fc:b8:88:eb brd ff:ff:ff:ff:ff:ff
altname enx0621fcb888eb
実行中: NetworkManager デバイス状態
コマンド: nmcli device status
DEVICE TYPE STATE CONNECTION
enX0 ethernet connected cloud-init enX0
lo loopback connected (externally) lo
実行中: NetworkManager 接続情報
コマンド: nmcli connection show
NAME UUID TYPE DEVICE
cloud-init enX0 396a5d18-eac6-5f9e-b669-fe35ace47588 ethernet enX0
lo 91c168ce-48dc-40e5-bdde-f173339cef64 loopback lo
実行中: ルーティングテーブル
コマンド: ip route show
default via 172.31.32.1 dev enX0 proto dhcp src 172.31.38.119 metric 100
172.31.32.0/20 dev enX0 proto kernel scope link src 172.31.38.119 metric 100
スキップ: ネットワーク統計 (コマンドが見つかりません)
実行中: ソケット統計
コマンド: ss -tuln
Netid State Recv-Q Send-Q Local Address:Port Peer Address:Port
udp UNCONN 0 0 127.0.0.1:323 0.0.0.0:*
udp UNCONN 0 0 [::1]:323 [::]:*
tcp LISTEN 0 128 0.0.0.0:22 0.0.0.0:*
tcp LISTEN 0 128 [::]:22 [::]:*
--- DNS・ホスト名設定 ---
実行中: DNS設定
コマンド: cat /etc/resolv.conf
# Generated by NetworkManager
search ap-northeast-1.compute.internal
nameserver 172.31.0.2
スキップ: systemd-resolve 状態 (コマンドが見つかりません)
実行中: resolvectl 状態
コマンド: resolvectl status
実行中: ホスト名
コマンド: hostname
ip-172-31-38-119.ap-northeast-1.compute.internal
実行中: ホスト詳細
コマンド: hostnamectl status
Static hostname: ip-172-31-38-119.ap-northeast-1.compute.internal
Icon name: computer-vm
Chassis: vm 🖴
Machine ID: ec27b13248f62a5414bbe980ae044bc7
Boot ID: 5d02018d455247fdb23af4083431d986
Product UUID: ec27b132-48f6-2a54-14bb-e980ae044bc7
Virtualization: xen
Operating System: Red Hat Enterprise Linux 10.0 (Coughlan)
CPE OS Name: cpe:/o:redhat:enterprise_linux:10::baseos
Kernel: Linux 6.12.0-55.9.1.el10_0.x86_64
Architecture: x86-64
Hardware Vendor: Xen
Hardware Model: HVM domU
Hardware Serial: ec27b132-48f6-2a54-14bb-e980ae044bc7
Firmware Version: 4.11.amazon
Firmware Date: Thu 2006-08-24
Firmware Age: 18y 9month 4w 1d
実行中: ホスト名ファイル
コマンド: cat /etc/hostname
ip-172-31-38-119.ap-northeast-1.compute.internal
================================================
ファイアウォール・セキュリティ
================================================
--- ファイアウォール設定 ---
実行中: firewalld 状態
コマンド: systemctl status firewalld
スキップ: ファイアウォール状態 (コマンドが見つかりません)
スキップ: ファイアウォール設定一覧 (コマンドが見つかりません)
スキップ: 許可サービス一覧 (コマンドが見つかりません)
スキップ: 許可ポート一覧 (コマンドが見つかりません)
スキップ: iptables ルール (コマンドが見つかりません)
--- SELinux設定 ---
実行中: SELinux 状態
コマンド: getenforce
Enforcing
実行中: SELinux 詳細状態
コマンド: sestatus
SELinux status: enabled
SELinuxfs mount: /sys/fs/selinux
SELinux root directory: /etc/selinux
Loaded policy name: targeted
Current mode: enforcing
Mode from config file: enforcing
Policy MLS status: enabled
Policy deny_unknown status: allowed
Memory protection checking: actual (secure)
Max kernel policy version: 33
実行中: SELinux 設定ファイル
コマンド: cat /etc/selinux/config
# This file controls the state of SELinux on the system.
# SELINUX= can take one of these three values:
# enforcing - SELinux security policy is enforced.
# permissive - SELinux prints warnings instead of enforcing.
# disabled - No SELinux policy is loaded.
# See also:
# https://docs.fedoraproject.org/en-US/quick-docs/getting-started-with-selinux/#getting-started-with-selinux-selinux-states-and-modes
#
# NOTE: In earlier Fedora kernel builds, SELINUX=disabled would also
# fully disable SELinux during boot. If you need a system with SELinux
# fully disabled instead of SELinux running with no policy loaded, you
# need to pass selinux=0 to the kernel command line. You can use grubby
# to persistently set the bootloader to boot with selinux=0:
#
# grubby --update-kernel ALL --args selinux=0
#
# To revert back to SELinux enabled:
#
# grubby --update-kernel ALL --remove-args selinux
#
SELINUX=enforcing
# SELINUXTYPE= can take one of these three values:
# targeted - Targeted processes are protected,
# minimum - Modification of targeted policy. Only selected processes are protected.
# mls - Multi Level Security protection.
SELINUXTYPE=targeted
実行中: SELinux ブール値サンプル
コマンド: semanage boolean -l | grep -E '(httpd|ssh|ftp)' | head -10
fenced_can_ssh (off , off) Allow fenced to can ssh
ftpd_anon_write (off , off) Allow ftpd to anon write
ftpd_connect_all_unreserved (off , off) Allow ftpd to connect all unreserved
ftpd_connect_db (off , off) Allow ftpd to connect db
ftpd_full_access (off , off) Allow ftpd to full access
ftpd_use_cifs (off , off) Allow ftpd to use cifs
ftpd_use_fusefs (off , off) Allow ftpd to use fusefs
ftpd_use_nfs (off , off) Allow ftpd to use nfs
ftpd_use_passive_mode (off , off) Allow ftpd to use passive mode
httpd_anon_write (off , off) Allow httpd to anon write
実行中: SELinux ブール値確認
コマンド: getsebool -a | grep -E '(httpd|ssh|ftp)' | head -10
fenced_can_ssh --> off
ftpd_anon_write --> off
ftpd_connect_all_unreserved --> off
ftpd_connect_db --> off
ftpd_full_access --> off
ftpd_use_cifs --> off
ftpd_use_fusefs --> off
ftpd_use_nfs --> off
ftpd_use_passive_mode --> off
httpd_anon_write --> off
================================================
ユーザー・グループ管理
================================================
--- ユーザー情報 ---
実行中: 現在のユーザー
コマンド: whoami
root
実行中: ユーザーID情報
コマンド: id
uid=0(root) gid=0(root) groups=0(root) context=unconfined_u:unconfined_r:unconfined_t:s0-s0:c0.c1023
実行中: 所属グループ
コマンド: groups
root
実行中: 一般ユーザー一覧
コマンド: cat /etc/passwd | grep -E ':(100[0-9]|[5-9][0-9]{2}):' | cut -d: -f1
yggdrasil
yggdrasil-worker
systemd-oom
dhcpcd
sssd
chrony
systemd-coredump
ec2-user
実行中: ログイン可能ユーザー
コマンド: getent passwd | grep -v nologin | grep -v false | head -10
root:x:0:0:Super User:/root:/bin/bash
sync:x:5:0:sync:/sbin:/bin/sync
shutdown:x:6:0:shutdown:/sbin:/sbin/shutdown
halt:x:7:0:halt:/sbin:/sbin/halt
ec2-user:x:1000:1000:Cloud User:/home/ec2-user:/bin/bash
実行中: sudo 権限
コマンド: sudo -l
Matching Defaults entries for root on ip-172-31-38-119:
!visiblepw, always_set_home, match_group_by_gid, always_query_group_plugin, env_reset, env_keep="COLORS DISPLAY HOSTNAME HISTSIZE KDEDIR LS_COLORS",
env_keep+="MAIL PS1 PS2 QTDIR USERNAME LANG LC_ADDRESS LC_CTYPE", env_keep+="LC_COLLATE LC_IDENTIFICATION LC_MEASUREMENT LC_MESSAGES",
env_keep+="LC_MONETARY LC_NAME LC_NUMERIC LC_PAPER LC_TELEPHONE", env_keep+="LC_TIME LC_ALL LANGUAGE LINGUAS _XKB_CHARSET XAUTHORITY",
secure_path=/sbin\:/bin\:/usr/sbin\:/usr/bin
User root may run the following commands on ip-172-31-38-119:
(ALL) ALL
実行中: sudoers.d ディレクトリ
コマンド: ls -la /etc/sudoers.d/
total 16
drwxr-x---. 2 root root 33 Jun 22 23:43 .
drwxr-xr-x. 92 root root 8192 Jun 22 23:43 ..
-r--r-----. 1 root root 133 Jun 22 23:43 90-cloud-init-users
--- グループ情報 ---
実行中: グループ情報(一部)
コマンド: cat /etc/group | head -20
root:x:0:
bin:x:1:
daemon:x:2:
sys:x:3:
adm:x:4:ec2-user
tty:x:5:
disk:x:6:
lp:x:7:
mem:x:8:
kmem:x:9:
wheel:x:10:
cdrom:x:11:
mail:x:12:
man:x:15:
dialout:x:18:
floppy:x:19:
games:x:20:
tape:x:33:
video:x:39:
ftp:x:50:
実行中: グループエントリ
コマンド: getent group | head -10
root:x:0:
bin:x:1:
daemon:x:2:
sys:x:3:
adm:x:4:ec2-user
tty:x:5:
disk:x:6:
lp:x:7:
mem:x:8:
kmem:x:9:
実行中: 現在ユーザーのグループ
コマンド: groups $(whoami)
root : root
================================================
サービス・プロセス管理
================================================
--- systemd サービス ---
実行中: 実行中サービス
コマンド: systemctl list-units --type=service --state=running | head -15
UNIT LOAD ACTIVE SUB DESCRIPTION
auditd.service loaded active running Security Audit Logging Service
chronyd.service loaded active running NTP client/server
crond.service loaded active running Command Scheduler
dbus-broker.service loaded active running D-Bus System Message Bus
getty@tty1.service loaded active running Getty on tty1
NetworkManager.service loaded active running Network Manager
polkit.service loaded active running Authorization Manager
rhsmcertd.service loaded active running Enable periodic update of entitlement certificates.
rsyslog.service loaded active running System Logging Service
serial-getty@ttyS0.service loaded active running Serial Getty on ttyS0
sshd.service loaded active running OpenSSH server daemon
systemd-hostnamed.service loaded active running Hostname Service
systemd-journald.service loaded active running Journal Service
systemd-logind.service loaded active running User Login Management
実行中: 失敗したサービス
コマンド: systemctl list-units --state=failed
UNIT LOAD ACTIVE SUB DESCRIPTION
● kdump.service loaded failed failed Crash recovery kernel arming
Legend: LOAD → Reflects whether the unit definition was properly loaded.
ACTIVE → The high-level unit activation state, i.e. generalization of SUB.
SUB → The low-level unit activation state, values depend on unit type.
1 loaded units listed.
実行中: SSH サービス状態
コマンド: systemctl status sshd
● sshd.service - OpenSSH server daemon
Loaded: loaded (/usr/lib/systemd/system/sshd.service; enabled; preset: enabled)
Active: active (running) since Sun 2025-06-22 23:43:43 UTC; 10min ago
Invocation: 5d42a6b39ce143e893cb595cba716711
Docs: man:sshd(8)
man:sshd_config(5)
Main PID: 1182 (sshd)
Tasks: 1 (limit: 5687)
Memory: 5.1M (peak: 6.1M)
CPU: 40ms
CGroup: /system.slice/sshd.service
└─1182 "sshd: /usr/sbin/sshd -D [listener] 0 of 10-100 startups"
Jun 22 23:43:43 ip-172-31-38-119.ap-northeast-1.compute.internal sshd[1182]: Server listening on 0.0.0.0 port 22.
Jun 22 23:43:43 ip-172-31-38-119.ap-northeast-1.compute.internal sshd[1182]: Server listening on :: port 22.
Jun 22 23:43:42 ip-172-31-38-119.ap-northeast-1.compute.internal systemd[1]: Starting sshd.service - OpenSSH server daemon...
Jun 22 23:43:42 ip-172-31-38-119.ap-northeast-1.compute.internal (sshd)[1182]: sshd.service: Referenced but unset environment variable evaluates to an empty string: OPTIONS
Jun 22 23:43:43 ip-172-31-38-119.ap-northeast-1.compute.internal systemd[1]: Started sshd.service - OpenSSH server daemon.
Jun 22 23:45:53 ip-172-31-38-119.ap-northeast-1.compute.internal sshd-session[1283]: Accepted publickey for ec2-user from 111.188.192.134 port 49016 ssh2: RSA SHA256:qu29FKA0kjnLw/RDvc40pF2XIhH0Fab2DUCGFGrSaL4
Jun 22 23:45:53 ip-172-31-38-119.ap-northeast-1.compute.internal sshd-session[1283]: pam_unix(sshd:session): session opened for user ec2-user(uid=1000) by ec2-user(uid=0)
実行中: NetworkManager 状態
コマンド: systemctl status NetworkManager
● NetworkManager.service - Network Manager
Loaded: loaded (/usr/lib/systemd/system/NetworkManager.service; enabled; preset: enabled)
Active: active (running) since Sun 2025-06-22 23:43:40 UTC; 10min ago
Invocation: 86c20419609c42cc923afc70f048cd9d
Docs: man:NetworkManager(8)
Main PID: 775 (NetworkManager)
Tasks: 4 (limit: 5687)
Memory: 8.5M (peak: 8.7M)
CPU: 87ms
CGroup: /system.slice/NetworkManager.service
└─775 /usr/sbin/NetworkManager --no-daemon
Jun 22 23:43:40 ip-172-31-38-119.ap-northeast-1.compute.internal NetworkManager[775]: <info> [1750635820.2564] device (enX0): state change: ip-config -> ip-check (reason 'none', managed-type: 'full')
Jun 22 23:43:40 ip-172-31-38-119.ap-northeast-1.compute.internal NetworkManager[775]: <info> [1750635820.6052] device (lo): state change: ip-check -> secondaries (reason 'none', managed-type: 'external')
Jun 22 23:43:40 ip-172-31-38-119.ap-northeast-1.compute.internal NetworkManager[775]: <info> [1750635820.6111] device (lo): state change: secondaries -> activated (reason 'none', managed-type: 'external')
Jun 22 23:43:40 ip-172-31-38-119.ap-northeast-1.compute.internal NetworkManager[775]: <info> [1750635820.6124] device (lo): Activation: successful, device activated.
Jun 22 23:43:40 ip-172-31-38-119.ap-northeast-1.compute.internal NetworkManager[775]: <info> [1750635820.8600] device (enX0): state change: ip-check -> secondaries (reason 'none', managed-type: 'full')
Jun 22 23:43:40 ip-172-31-38-119.ap-northeast-1.compute.internal NetworkManager[775]: <info> [1750635820.8613] device (enX0): state change: secondaries -> activated (reason 'none', managed-type: 'full')
Jun 22 23:43:40 ip-172-31-38-119.ap-northeast-1.compute.internal NetworkManager[775]: <info> [1750635820.8663] manager: NetworkManager state is now CONNECTED_SITE
Jun 22 23:43:40 ip-172-31-38-119.ap-northeast-1.compute.internal NetworkManager[775]: <info> [1750635820.8677] device (enX0): Activation: successful, device activated.
Jun 22 23:43:40 ip-172-31-38-119.ap-northeast-1.compute.internal NetworkManager[775]: <info> [1750635820.8718] manager: NetworkManager state is now CONNECTED_GLOBAL
Jun 22 23:43:40 ip-172-31-38-119.ap-northeast-1.compute.internal NetworkManager[775]: <info> [1750635820.8733] manager: startup complete
実行中: firewalld 状態
コマンド: systemctl status firewalld
実行中: chronyd 状態
コマンド: systemctl status chronyd
● chronyd.service - NTP client/server
Loaded: loaded (/usr/lib/systemd/system/chronyd.service; enabled; preset: enabled)
Active: active (running) since Sun 2025-06-22 23:43:37 UTC; 10min ago
Invocation: 50a2d0af431e4753b40b3fcc83bfe1c5
Docs: man:chronyd(8)
man:chrony.conf(5)
Main PID: 738 (chronyd)
Tasks: 1 (limit: 5687)
Memory: 3.2M (peak: 3.9M)
CPU: 28ms
CGroup: /system.slice/chronyd.service
└─738 /usr/sbin/chronyd -F 2
Jun 22 23:43:37 localhost systemd[1]: Starting chronyd.service - NTP client/server...
Jun 22 23:43:37 localhost chronyd[738]: chronyd version 4.6.1 starting (+CMDMON +NTP +REFCLOCK +RTC +PRIVDROP +SCFILTER +SIGND +ASYNCDNS +NTS +SECHASH +IPV6 +DEBUG)
Jun 22 23:43:37 localhost chronyd[738]: Loaded seccomp filter (level 2)
Jun 22 23:43:37 localhost systemd[1]: Started chronyd.service - NTP client/server.
Jun 22 23:43:46 ip-172-31-38-119.ap-northeast-1.compute.internal chronyd[738]: Selected source 169.254.169.123
実行中: 自動起動サービス
コマンド: systemctl list-unit-files --type=service | grep enabled | head -15
audit-rules.service enabled enabled
auditd.service enabled enabled
chronyd.service enabled enabled
cloud-config.service enabled enabled
cloud-final.service enabled enabled
cloud-init-local.service enabled enabled
cloud-init.service enabled enabled
crond.service enabled enabled
dbus-broker.service enabled enabled
fips-crypto-policy-overlay.service enabled enabled
getty@.service enabled enabled
insights-client-boot.service enabled enabled
irqbalance.service enabled enabled
kdump.service enabled enabled
lvm2-monitor.service enabled enabled
--- プロセス確認 ---
実行中: プロセス一覧
コマンド: ps aux | head -15
USER PID %CPU %MEM VSZ RSS TTY STAT START TIME COMMAND
root 1 0.5 4.1 48348 40396 ? Ss 23:43 0:03 /usr/lib/systemd/systemd --switched-root --system --deserialize=45
root 2 0.0 0.0 0 0 ? S 23:43 0:00 [kthreadd]
root 3 0.0 0.0 0 0 ? S 23:43 0:00 [pool_workqueue_release]
root 4 0.0 0.0 0 0 ? I< 23:43 0:00 [kworker/R-rcu_gp]
root 5 0.0 0.0 0 0 ? I< 23:43 0:00 [kworker/R-sync_wq]
root 6 0.0 0.0 0 0 ? I< 23:43 0:00 [kworker/R-slub_flushwq]
root 7 0.0 0.0 0 0 ? I< 23:43 0:00 [kworker/R-netns]
root 8 0.0 0.0 0 0 ? I 23:43 0:00 [kworker/0:0-events]
root 9 0.0 0.0 0 0 ? I 23:43 0:00 [kworker/0:1-events_power_efficient]
root 10 0.0 0.0 0 0 ? I< 23:43 0:00 [kworker/0:0H-events_highpri]
root 12 0.0 0.0 0 0 ? I 23:43 0:00 [kworker/u60:1-events_unbound]
root 13 0.0 0.0 0 0 ? I< 23:43 0:00 [kworker/R-mm_percpu_wq]
root 14 0.0 0.0 0 0 ? I 23:43 0:00 [rcu_tasks_kthread]
root 15 0.0 0.0 0 0 ? I 23:43 0:00 [rcu_tasks_rude_kthread]
実行中: プロセス詳細
コマンド: ps -ef | head -15
UID PID PPID C STIME TTY TIME CMD
root 1 0 0 23:43 ? 00:00:03 /usr/lib/systemd/systemd --switched-root --system --deserialize=45
root 2 0 0 23:43 ? 00:00:00 [kthreadd]
root 3 2 0 23:43 ? 00:00:00 [pool_workqueue_release]
root 4 2 0 23:43 ? 00:00:00 [kworker/R-rcu_gp]
root 5 2 0 23:43 ? 00:00:00 [kworker/R-sync_wq]
root 6 2 0 23:43 ? 00:00:00 [kworker/R-slub_flushwq]
root 7 2 0 23:43 ? 00:00:00 [kworker/R-netns]
root 8 2 0 23:43 ? 00:00:00 [kworker/0:0-events]
root 9 2 0 23:43 ? 00:00:00 [kworker/0:1-events_power_efficient]
root 10 2 0 23:43 ? 00:00:00 [kworker/0:0H-events_highpri]
root 12 2 0 23:43 ? 00:00:00 [kworker/u60:1-events_unbound]
root 13 2 0 23:43 ? 00:00:00 [kworker/R-mm_percpu_wq]
root 14 2 0 23:43 ? 00:00:00 [rcu_tasks_kthread]
root 15 2 0 23:43 ? 00:00:00 [rcu_tasks_rude_kthread]
実行中: プロセスツリー
コマンド: pstree | head -20
systemd-+-NetworkManager---3*[{NetworkManager}]
|-2*[agetty]
|-auditd---{auditd}
|-chronyd
|-crond
|-dbus-broker-lau---dbus-broker
|-polkitd---3*[{polkitd}]
|-rhsmcertd---{rhsmcertd}
|-rsyslogd---2*[{rsyslogd}]
|-sshd---sshd-session---sshd-session---bash---sudo---sudo---rhel_system_che-+-head
| `-pstree
|-systemd---(sd-pam)
|-systemd-hostnam
|-systemd-journal
|-systemd-logind
|-systemd-udevd
|-systemd-userdbd---3*[systemd-userwor]
`-tuned---3*[{tuned}]
実行中: システム稼働時間
コマンド: uptime
23:53:55 up 10 min, 2 users, load average: 0.08, 0.02, 0.01
実行中: 仮想メモリ統計
コマンド: vmstat 1 3
procs -----------memory---------- ---swap-- -----io---- -system-- -------cpu-------
r b swpd free buff cache si so bi bo in cs us sy id wa st gu
0 0 0 556456 2928 231192 0 0 344 40 191 1 1 1 95 0 2 0
0 0 0 556456 2928 231240 0 0 0 0 136 86 0 0 100 0 0 0
0 0 0 556456 2928 231240 0 0 0 0 132 85 0 0 100 0 0 0
================================================
ログ管理
================================================
--- systemd ログ ---
実行中: ブートログ(最新10行)
コマンド: journalctl -b | tail -10
Jun 22 23:51:20 ip-172-31-38-119.ap-northeast-1.compute.internal systemd[1288]: Created slice background.slice - User Background Tasks Slice.
Jun 22 23:51:20 ip-172-31-38-119.ap-northeast-1.compute.internal systemd[1288]: Starting systemd-tmpfiles-clean.service - Cleanup of User's Temporary Files and Directories...
Jun 22 23:51:20 ip-172-31-38-119.ap-northeast-1.compute.internal systemd[1288]: Finished systemd-tmpfiles-clean.service - Cleanup of User's Temporary Files and Directories.
Jun 22 23:53:54 ip-172-31-38-119.ap-northeast-1.compute.internal systemd[1]: Starting nm-cloud-setup.service - Automatically configure NetworkManager in cloud...
Jun 22 23:53:54 ip-172-31-38-119.ap-northeast-1.compute.internal sudo[1383]: ec2-user : TTY=pts/0 ; PWD=/home/ec2-user ; USER=root ; COMMAND=./rhel_system_check.sh
Jun 22 23:53:54 ip-172-31-38-119.ap-northeast-1.compute.internal sudo[1383]: pam_unix(sudo:session): session opened for user root(uid=0) by ec2-user(uid=1000)
Jun 22 23:53:54 ip-172-31-38-119.ap-northeast-1.compute.internal systemd[1]: Starting systemd-hostnamed.service - Hostname Service...
Jun 22 23:53:54 ip-172-31-38-119.ap-northeast-1.compute.internal systemd[1]: nm-cloud-setup.service: Deactivated successfully.
Jun 22 23:53:54 ip-172-31-38-119.ap-northeast-1.compute.internal systemd[1]: Finished nm-cloud-setup.service - Automatically configure NetworkManager in cloud.
Jun 22 23:53:54 ip-172-31-38-119.ap-northeast-1.compute.internal systemd[1]: Started systemd-hostnamed.service - Hostname Service.
実行中: SSH ログ(最新5行)
コマンド: journalctl -u sshd | tail -5
Jun 22 23:43:42 ip-172-31-38-119.ap-northeast-1.compute.internal systemd[1]: Starting sshd.service - OpenSSH server daemon...
Jun 22 23:43:42 ip-172-31-38-119.ap-northeast-1.compute.internal (sshd)[1182]: sshd.service: Referenced but unset environment variable evaluates to an empty string: OPTIONS
Jun 22 23:43:43 ip-172-31-38-119.ap-northeast-1.compute.internal systemd[1]: Started sshd.service - OpenSSH server daemon.
Jun 22 23:45:53 ip-172-31-38-119.ap-northeast-1.compute.internal sshd-session[1283]: Accepted publickey for ec2-user from 111.188.192.134 port 49016 ssh2: RSA SHA256:qu29FKA0kjnLw/RDvc40pF2XIhH0Fab2DUCGFGrSaL4
Jun 22 23:45:53 ip-172-31-38-119.ap-northeast-1.compute.internal sshd-session[1283]: pam_unix(sshd:session): session opened for user ec2-user(uid=1000) by ec2-user(uid=0)
実行中: エラーログ(最新5行)
コマンド: journalctl -p err | tail -5
Jun 22 23:43:27 localhost kernel: Cannot get hvm parameter CONSOLE_EVTCHN (18): -22!
Jun 22 23:43:27 localhost kernel: Cannot get hvm parameter CONSOLE_EVTCHN (18): -22!
Jun 22 23:43:37 localhost systemd[1]: rhcd.path: Refusing to start, unit rhcd.service to trigger not loaded.
Jun 22 23:43:37 localhost systemd[1]: Failed to start rhcd.path - Automatically start rhcd with path watch.
Jun 22 23:43:43 ip-172-31-38-119.ap-northeast-1.compute.internal systemd[1]: Failed to start kdump.service - Crash recovery kernel arming.
実行中: ジャーナルディスク使用量
コマンド: journalctl --disk-usage
Archived and active journals take up 3M in the file system.
実行中: ジャーナル設定
コマンド: cat /etc/systemd/journald.conf | grep -v '^#' | grep -v '^$'
--- 従来のログファイル ---
実行中: メッセージログ
コマンド: tail -5 /var/log/messages
Jun 22 23:53:54 ip-172-31-38-119 systemd[1]: Starting nm-cloud-setup.service - Automatically configure NetworkManager in cloud...
Jun 22 23:53:54 ip-172-31-38-119 systemd[1]: Starting systemd-hostnamed.service - Hostname Service...
Jun 22 23:53:54 ip-172-31-38-119 systemd[1]: nm-cloud-setup.service: Deactivated successfully.
Jun 22 23:53:54 ip-172-31-38-119 systemd[1]: Finished nm-cloud-setup.service - Automatically configure NetworkManager in cloud.
Jun 22 23:53:54 ip-172-31-38-119 systemd[1]: Started systemd-hostnamed.service - Hostname Service.
実行中: セキュリティログ
コマンド: tail -5 /var/log/secure
Jun 22 23:45:53 ip-172-31-38-119 sshd-session[1283]: Accepted publickey for ec2-user from 111.188.192.134 port 49016 ssh2: RSA SHA256:qu29FKA0kjnLw/RDvc40pF2XIhH0Fab2DUCGFGrSaL4
Jun 22 23:45:53 ip-172-31-38-119 (systemd)[1288]: pam_unix(systemd-user:session): session opened for user ec2-user(uid=1000) by ec2-user(uid=0)
Jun 22 23:45:53 ip-172-31-38-119 sshd-session[1283]: pam_unix(sshd:session): session opened for user ec2-user(uid=1000) by ec2-user(uid=0)
Jun 22 23:53:54 ip-172-31-38-119 sudo[1383]: ec2-user : TTY=pts/0 ; PWD=/home/ec2-user ; USER=root ; COMMAND=./rhel_system_check.sh
Jun 22 23:53:54 ip-172-31-38-119 sudo[1383]: pam_unix(sudo:session): session opened for user root(uid=0) by ec2-user(uid=1000)
実行中: 監査ログディレクトリ
コマンド: ls -la /var/log/audit/
total 40
drwx------. 2 root root 23 Jun 22 23:43 .
drwxr-xr-x. 9 root root 4096 Jun 22 23:43 ..
-rw-------. 1 root root 35269 Jun 22 23:53 audit.log
実行中: ログローテーション設定
コマンド: cat /etc/logrotate.conf | grep -v '^#' | grep -v '^$' | head -10
weekly
rotate 4
create
dateext
include /etc/logrotate.d
================================================
パッケージ管理
================================================
--- DNF/YUM コマンド ---
実行中: インストール済みパッケージ数
コマンド: dnf list installed | wc -l
528
実行中: インストール済みパッケージ(一部)
コマンド: dnf list installed | head -10
Updating Subscription Management repositories.
Unable to read consumer identity
This system is not registered with an entitlement server. You can use "rhc" or "subscription-manager" to register.
Installed Packages
NetworkManager.x86_64 1:1.52.0-3.el10_0 @System
NetworkManager-cloud-setup.x86_64 1:1.52.0-3.el10_0 @System
NetworkManager-libnm.x86_64 1:1.52.0-3.el10_0 @System
NetworkManager-tui.x86_64 1:1.52.0-3.el10_0 @System
実行中: リポジトリ一覧
コマンド: dnf repolist
Updating Subscription Management repositories.
Unable to read consumer identity
This system is not registered with an entitlement server. You can use "rhc" or "subscription-manager" to register.
repo id repo name
rhel-10-appstream-rhui-rpms Red Hat Enterprise Linux 10 for x86_64 - AppStream from RHUI (RPMs)
rhel-10-baseos-rhui-rpms Red Hat Enterprise Linux 10 for x86_64 - BaseOS from RHUI (RPMs)
rhui-client-config-server-10 Red Hat Enterprise Linux 10 Client Configuration
実行中: リポジトリ設定ファイル
コマンド: ls -la /etc/yum.repos.d/
total 24
drwxr-xr-x. 2 root root 68 Apr 23 14:16 .
drwxr-xr-x. 92 root root 8192 Jun 22 23:43 ..
-rw-r--r--. 1 root root 473 Apr 23 14:16 redhat-rhui-client-config.repo
-rw-r--r--. 1 root root 5956 Apr 23 14:16 redhat-rhui.repo
実行中: アップデート可能パッケージ
コマンド: dnf check-update | head -10
Updating Subscription Management repositories.
Unable to read consumer identity
This system is not registered with an entitlement server. You can use "rhc" or "subscription-manager" to register.
Red Hat Enterprise Linux 10 for x86_64 - AppStr 19 MB/s | 2.8 MB 00:00
Red Hat Enterprise Linux 10 for x86_64 - BaseOS 19 MB/s | 8.3 MB 00:00
Red Hat Enterprise Linux 10 Client Configuratio 20 kB/s | 1.6 kB 00:00
kernel.x86_64 6.12.0-55.17.1.el10_0 rhel-10-baseos-rhui-rpms
実行中: DNF 履歴
コマンド: dnf history | head -10
Updating Subscription Management repositories.
Unable to read consumer identity
This system is not registered with an entitlement server. You can use "rhc" or "subscription-manager" to register.
ID | Command line | Date and time | Action(s) | Altered
-------------------------------------------------------------------------------------------------------------------------------------------------------------
--- RPM コマンド ---
実行中: RPMパッケージ総数
コマンド: rpm -qa | wc -l
525
実行中: RPMパッケージ一覧(一部)
コマンド: rpm -qa | head -10
libgcc-14.2.1-7.el10.x86_64
linux-firmware-whence-20250314-15.el10.noarch
tzdata-2025b-1.el10.noarch
fonts-filesystem-2.0.5-18.el10.noarch
hunspell-filesystem-1.7.2-9.el10.x86_64
google-noto-fonts-common-20240401-5.el10.noarch
subscription-manager-rhsm-certificates-20220623-6.el10.noarch
hwdata-0.379-10.4.el10.noarch
google-noto-sans-mono-vf-fonts-20240401-5.el10.noarch
google-noto-sans-vf-fonts-20240401-5.el10.noarch
================================================
時刻同期・タイムゾーン
================================================
実行中: 現在時刻
コマンド: date
Sun Jun 22 23:54:03 UTC 2025
実行中: 時刻詳細
コマンド: timedatectl status
Local time: Sun 2025-06-22 23:54:03 UTC
Universal time: Sun 2025-06-22 23:54:03 UTC
RTC time: Sun 2025-06-22 23:54:03
Time zone: UTC (UTC, +0000)
System clock synchronized: yes
NTP service: active
RTC in local TZ: no
実行中: Asiaタイムゾーン
コマンド: timedatectl list-timezones | grep Asia | head -10
Asia/Aden
Asia/Almaty
Asia/Amman
Asia/Anadyr
Asia/Aqtau
Asia/Aqtobe
Asia/Ashgabat
Asia/Ashkhabad
Asia/Atyrau
Asia/Baghdad
実行中: chronyd 状態
コマンド: systemctl status chronyd
● chronyd.service - NTP client/server
Loaded: loaded (/usr/lib/systemd/system/chronyd.service; enabled; preset: enabled)
Active: active (running) since Sun 2025-06-22 23:43:37 UTC; 10min ago
Invocation: 50a2d0af431e4753b40b3fcc83bfe1c5
Docs: man:chronyd(8)
man:chrony.conf(5)
Main PID: 738 (chronyd)
Tasks: 1 (limit: 5687)
Memory: 3.2M (peak: 3.9M)
CPU: 28ms
CGroup: /system.slice/chronyd.service
└─738 /usr/sbin/chronyd -F 2
Jun 22 23:43:37 localhost systemd[1]: Starting chronyd.service - NTP client/server...
Jun 22 23:43:37 localhost chronyd[738]: chronyd version 4.6.1 starting (+CMDMON +NTP +REFCLOCK +RTC +PRIVDROP +SCFILTER +SIGND +ASYNCDNS +NTS +SECHASH +IPV6 +DEBUG)
Jun 22 23:43:37 localhost chronyd[738]: Loaded seccomp filter (level 2)
Jun 22 23:43:37 localhost systemd[1]: Started chronyd.service - NTP client/server.
Jun 22 23:43:46 ip-172-31-38-119.ap-northeast-1.compute.internal chronyd[738]: Selected source 169.254.169.123
スキップ: chrony ソース (コマンドが見つかりません)
スキップ: chrony 追跡状態 (コマンドが見つかりません)
================================================
ストレージ・ファイルシステム
================================================
実行中: ディスク使用量
コマンド: df -h
Filesystem Size Used Avail Use% Mounted on
/dev/xvda3 9.8G 1.6G 8.2G 16% /
devtmpfs 4.0M 0 4.0M 0% /dev
tmpfs 476M 0 476M 0% /dev/shm
tmpfs 191M 3.6M 187M 2% /run
tmpfs 1.0M 0 1.0M 0% /run/credentials/systemd-journald.service
/dev/xvda2 200M 8.4M 192M 5% /boot/efi
tmpfs 1.0M 0 1.0M 0% /run/credentials/getty@tty1.service
tmpfs 1.0M 0 1.0M 0% /run/credentials/serial-getty@ttyS0.service
tmpfs 96M 4.0K 96M 1% /run/user/1000
実行中: ディレクトリサイズ
コマンド: du -sh /* 2>/dev/null | head -10
0 /afs
0 /bin
94M /boot
0 /dev
23M /etc
32K /home
0 /lib
0 /lib64
0 /media
0 /mnt
実行中: ファイルシステム情報
コマンド: lsblk -f
NAME FSTYPE FSVER LABEL UUID FSAVAIL FSUSE% MOUNTPOINTS
xvda
├─xvda1
├─xvda2 vfat FAT16 7B77-95E7 191.4M 4% /boot/efi
└─xvda3 xfs root 266a8881-a1f0-4bfd-932c-685f3bfa17ff 8.2G 16% /
実行中: マウント情報
コマンド: mount | grep -E '(ext4|xfs|btrfs)'
/dev/xvda3 on / type xfs (rw,relatime,seclabel,attr2,inode64,logbufs=8,logbsize=32k,noquota)
selinuxfs on /sys/fs/selinux type selinuxfs (rw,nosuid,noexec,relatime)
実行中: fstab設定
コマンド: cat /etc/fstab
UUID=266a8881-a1f0-4bfd-932c-685f3bfa17ff / xfs defaults 0 0
UUID=7B77-95E7 /boot/efi vfat defaults,uid=0,gid=0,umask=077,shortname=winnt 0 2
実行中: マウントポイント
コマンド: findmnt | head -15
TARGET SOURCE FSTYPE OPTIONS
/ /dev/xvda3 xfs rw,relatime,seclabel,attr2,inode64,logbufs=8,logbsize=32k,noquota
├─/dev devtmpfs devtmpfs rw,nosuid,seclabel,size=4096k,nr_inodes=113806,mode=755,inode64
│ ├─/dev/hugepages hugetlbfs hugetlbfs rw,nosuid,nodev,relatime,seclabel,pagesize=2M
│ ├─/dev/mqueue mqueue mqueue rw,nosuid,nodev,noexec,relatime,seclabel
│ ├─/dev/shm tmpfs tmpfs rw,nosuid,nodev,seclabel,inode64
│ └─/dev/pts devpts devpts rw,nosuid,noexec,relatime,seclabel,gid=5,mode=620,ptmxmode=000
├─/sys sysfs sysfs rw,nosuid,nodev,noexec,relatime,seclabel
│ ├─/sys/fs/selinux selinuxfs selinuxfs rw,nosuid,noexec,relatime
│ ├─/sys/kernel/debug debugfs debugfs rw,nosuid,nodev,noexec,relatime,seclabel
│ ├─/sys/kernel/tracing tracefs tracefs rw,nosuid,nodev,noexec,relatime,seclabel
│ ├─/sys/fs/fuse/connections fusectl fusectl rw,nosuid,nodev,noexec,relatime
│ ├─/sys/kernel/security securityfs securityfs rw,nosuid,nodev,noexec,relatime
│ ├─/sys/fs/cgroup cgroup2 cgroup2 rw,nosuid,nodev,noexec,relatime,seclabel,nsdelegate,memory_recursiveprot
│ ├─/sys/fs/pstore pstore pstore rw,nosuid,nodev,noexec,relatime,seclabel
実行中: 物理ボリューム
コマンド: pvs
実行中: ボリュームグループ
コマンド: vgs
実行中: 論理ボリューム
コマンド: lvs
================================================
パフォーマンス・モニタリング
================================================
実行中: システム負荷
コマンド: uptime
23:54:03 up 10 min, 2 users, load average: 0.15, 0.03, 0.01
実行中: ログインユーザー
コマンド: w
23:54:03 up 10 min, 2 users, load average: 0.15, 0.03, 0.01
USER TTY LOGIN@ IDLE JCPU PCPU WHAT
ec2-user 23:45 0.00s 0.00s 0.02s sshd-session: ec2-user [priv]
ec2-user 23:45 0.00s 0.00s 0.07s /usr/lib/systemd/systemd --user
実行中: ロードアベレージ
コマンド: cat /proc/loadavg
0.15 0.03 0.01 1/120 1635
実行中: メモリ詳細
コマンド: cat /proc/meminfo | head -10
MemTotal: 974192 kB
MemFree: 505748 kB
MemAvailable: 622828 kB
Buffers: 2932 kB
Cached: 236292 kB
SwapCached: 0 kB
Active: 195192 kB
Inactive: 122112 kB
Active(anon): 83244 kB
Inactive(anon): 0 kB
実行中: 起動時間分析
コマンド: systemd-analyze
Startup finished in 2.568s (kernel) + 4.155s (initrd) + 13.497s (userspace) = 20.221s
multi-user.target reached after 12.546s in userspace.
実行中: 起動時間詳細
コマンド: systemd-analyze blame | head -10
6.447s sys-module-configfs.device
6.431s sys-devices-platform-serial8250-serial8250:0-serial8250:0.1-tty-ttyS1.device
6.431s dev-ttyS1.device
6.430s sys-devices-pnp0-00:06-00:06:0-00:06:0.0-tty-ttyS0.device
6.428s dev-ttyS0.device
6.419s dev-ttyS2.device
6.419s sys-devices-platform-serial8250-serial8250:0-serial8250:0.2-tty-ttyS2.device
6.417s dev-ttyS3.device
6.417s sys-devices-platform-serial8250-serial8250:0-serial8250:0.3-tty-ttyS3.device
5.917s dev-xvda1.device
================================================
RHEL10 特有の確認項目
================================================
スキップ: Podman バージョン (コマンドが見つかりません)
スキップ: Podman システム情報 (コマンドが見つかりません)
スキップ: PHP バージョン (コマンドが見つかりません)
スキップ: Node.js バージョン (コマンドが見つかりません)
スキップ: npm バージョン (コマンドが見つかりません)
実行中: Python バージョン
コマンド: python3 --version
Python 3.12.9
================================================
設定ファイル確認
================================================
実行中: OS リリース情報
コマンド: cat /etc/os-release
NAME="Red Hat Enterprise Linux"
VERSION="10.0 (Coughlan)"
ID="rhel"
ID_LIKE="centos fedora"
VERSION_ID="10.0"
PLATFORM_ID="platform:el10"
PRETTY_NAME="Red Hat Enterprise Linux 10.0 (Coughlan)"
ANSI_COLOR="0;31"
LOGO="fedora-logo-icon"
CPE_NAME="cpe:/o:redhat:enterprise_linux:10::baseos"
HOME_URL="https://www.redhat.com/"
VENDOR_NAME="Red Hat"
VENDOR_URL="https://www.redhat.com/"
DOCUMENTATION_URL="https://access.redhat.com/documentation/en-us/red_hat_enterprise_linux/10"
BUG_REPORT_URL="https://issues.redhat.com/"
REDHAT_BUGZILLA_PRODUCT="Red Hat Enterprise Linux 10"
REDHAT_BUGZILLA_PRODUCT_VERSION=10.0
REDHAT_SUPPORT_PRODUCT="Red Hat Enterprise Linux"
REDHAT_SUPPORT_PRODUCT_VERSION="10.0"
実行中: マシンID
コマンド: cat /etc/machine-id
ec27b13248f62a5414bbe980ae044bc7
実行中: ロケール設定
コマンド: cat /etc/locale.conf
LANG=C.UTF-8
実行中: hosts ファイル
コマンド: cat /etc/hosts
# Loopback entries; do not change.
# For historical reasons, localhost precedes localhost.localdomain:
127.0.0.1 localhost localhost.localdomain localhost4 localhost4.localdomain4
::1 localhost localhost.localdomain localhost6 localhost6.localdomain6
# See hosts(5) for proper format and other examples:
# 192.168.1.10 foo.example.org foo
# 192.168.1.13 bar.example.org bar
実行中: NSS設定
コマンド: cat /etc/nsswitch.conf | grep -v '^#'
passwd: files sss systemd
shadow: files
group: files [SUCCESS=merge] sss [SUCCESS=merge] systemd
hosts: files dns myhostname
services: files sss
netgroup: files sss
automount: files sss
aliases: files
ethers: files
gshadow: files
networks: files dns
protocols: files
publickey: files
rpc: files
実行中: NetworkManager 接続設定
コマンド: ls -la /etc/NetworkManager/system-connections/
total 4
drwxr-xr-x. 2 root root 42 Jun 22 23:43 .
drwxr-xr-x. 7 root root 134 Apr 23 14:16 ..
-rw-------. 1 root root 298 Jun 22 23:43 cloud-init-enX0.nmconnection
================================================
システムヘルスチェック
================================================
実行中: 失敗したサービス
コマンド: systemctl --failed
UNIT LOAD ACTIVE SUB DESCRIPTION
● kdump.service loaded failed failed Crash recovery kernel arming
Legend: LOAD → Reflects whether the unit definition was properly loaded.
ACTIVE → The high-level unit activation state, i.e. generalization of SUB.
SUB → The low-level unit activation state, values depend on unit type.
1 loaded units listed.
実行中: 過去1時間のエラー数
コマンド: journalctl -p err --since '1 hour ago' | wc -l
5
実行中: カーネルメッセージ
コマンド: dmesg | tail -10
[ 12.417295] RAPL PMU: API unit is 2^-32 Joules, 0 fixed counters, 655360 ms ovfl timer
[ 12.431313] Console: switching to colour frame buffer device 128x48
[ 12.445740] cirrus 0000:00:02.0: [drm] fb0: cirrusdrmfb frame buffer device
[ 12.523240] vif vif-0 enX0: renamed from eth0
[ 15.426154] 8021q: 802.1Q VLAN Support v1.8
[ 15.539667] cfg80211: Loading compiled-in X.509 certificates for regulatory database
[ 15.548842] Loaded X.509 cert 'sforshee: 00b28ddf47aef9cea7'
[ 15.555744] Loaded X.509 cert 'wens: 61c038651aabdcf94bd0ac7ff06c7248db18c600'
[ 15.582974] platform regulatory.0: Direct firmware load for regulatory.db failed with error -2
[ 15.583021] cfg80211: failed to load regulatory.db
実行中: CPU使用率上位プロセス
コマンド: ps aux --sort=-%cpu | head -5
USER PID %CPU %MEM VSZ RSS TTY STAT START TIME COMMAND
root 1598 2.9 0.7 15568 6852 ? Ss 23:54 0:00 /usr/lib/systemd/systemd-timedated
root 1 0.7 4.1 48348 40396 ? Ss 23:43 0:04 /usr/lib/systemd/systemd --switched-root --system --deserialize=45
root 1390 0.4 0.3 4556 3116 pts/1 S+ 23:53 0:00 /bin/bash ./rhel_system_check.sh
root 1399 0.3 0.9 17060 8800 ? Ss 23:53 0:00 /usr/lib/systemd/systemd-hostnamed
実行中: メモリ使用率上位プロセス
コマンド: ps aux --sort=-%mem | head -5
USER PID %CPU %MEM VSZ RSS TTY STAT START TIME COMMAND
root 1 0.7 4.1 48348 40396 ? Ss 23:43 0:04 /usr/lib/systemd/systemd --switched-root --system --deserialize=45
root 794 0.0 2.8 255932 27292 ? Ssl 23:43 0:00 /usr/bin/python3 -Es /usr/sbin/tuned -l -P
root 775 0.0 1.7 326720 17056 ? Ssl 23:43 0:00 /usr/sbin/NetworkManager --no-daemon
ec2-user 1288 0.0 1.3 21556 13096 ? Ss 23:45 0:00 /usr/lib/systemd/systemd --user
スキップ: 開いているファイル数 (コマンドが見つかりません)
================================================
チェック完了
================================================
まとめ
簡単ですがRHEL10の機能検証を行ってみました。そのうえで、新機能・システム移行について言及できていないため、次回以降、そのあたりも触れていきたいと思います。
そのうえで、設定チェックについてはClaudeを用いてスクリプト生成⇒実行する方式だと運用が楽になるのではないかと思っています。
ざっくりとした記事ですが最後までお読みいただきありがとうございます。
参考サイト