Xdebug
Xdebug's (remote) debugger allows you to examine data structure, The Xdebug extension provides debugging
and profiling capabilities for PHP scripts.
Xdebug supports PHP 5.4, 5.5, 5.6, 7.0, 7.1, 7.2, and 7.3.
You can debug your PHP coding using built functions like print_r() or var_dump() or using log file however this is not enough and it will slow you down during developing.
by using Magento2+xdebug it will speed you up during developing and it will make your life easier
Installing Xdebug
Preconditions
- you have Magento2+Vagrant environment
※ If you don't haveMagento2+Vagrantenvironment you can follow this tutorial magento2:開発環境構築 Vagrant - PHP version is 7.1~
- you already install PHPSTORM
install Xdebug (inside Vagrant)
sudo pecl install xdebug
On my server, I got the following output.
Build process completed successfully
Installing '/usr/lib/php/20151012/xdebug.so'
install ok: channel://pecl.php.net/xdebug-2.6.1
configuration option "php_ini" is not set to php.ini location
You should add "zend_extension=/usr/lib/php/20151012/xdebug.so" to php.ini
Next, we need to enable the xdebug extension by modifying the php.ini configuration file
/etc/php/7.1/fpm/php.ini or /etc/php/7.1/fpm/conf.d/20-xdebug.ini
sudo vim /etc/php/7.1/fpm/php.ini
zend_extension=/usr/lib/php/20151012/xdebug.so
xdebug.remote_host=192.168.33.10
xdebug.remote_enable=1
xdebug.remote_port=9900
xdebug.idekey="PHPSTORM"
xdebug.remote_log="/tmp/xdebug.log"
xdebug.remote_host You can set it to a specific domain or a IP address. im my case I set 192.168.33.10 because it is my vagrant private network IP
xdebug.remote_port You can set it to a specific port by default it will be 9000 In case I set to 9000 since my 9000 port is listen to something else.
xdebug.idekey since I use PHPSTORM ID I setted to PHPSTORM
xdebug.remote_log it is used as filename to a file to which all remote debugger communications are logged.
after setting you to need to restart your web server.
in case you Apache
sudo /etc/init.d/apache2 restart
in case you Nginx
sudo /etc/init.d/nginx restart
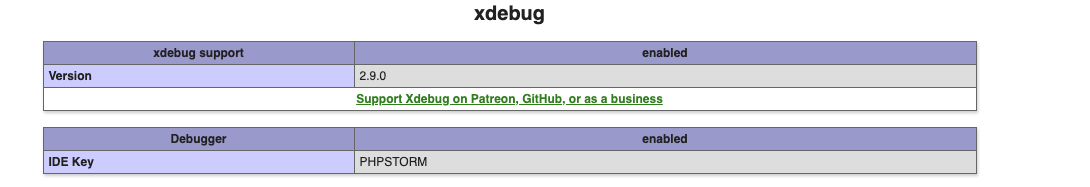
To verify if xdebug successfully enable. You can add phpinfo() into [magento-folder]/pub/index.php
in my case, it was /var/www/html/pub/index.php
you should get output like this.
Configuring XDebug client
In my case, I will Configure PHPStorm IDEA
open your project in phpstorm
you will set the port as you set it in php.ini of xdebug.remote_port
PHPSTORM -> Preference -> Languages & Frameworks -> PHP -> Debug
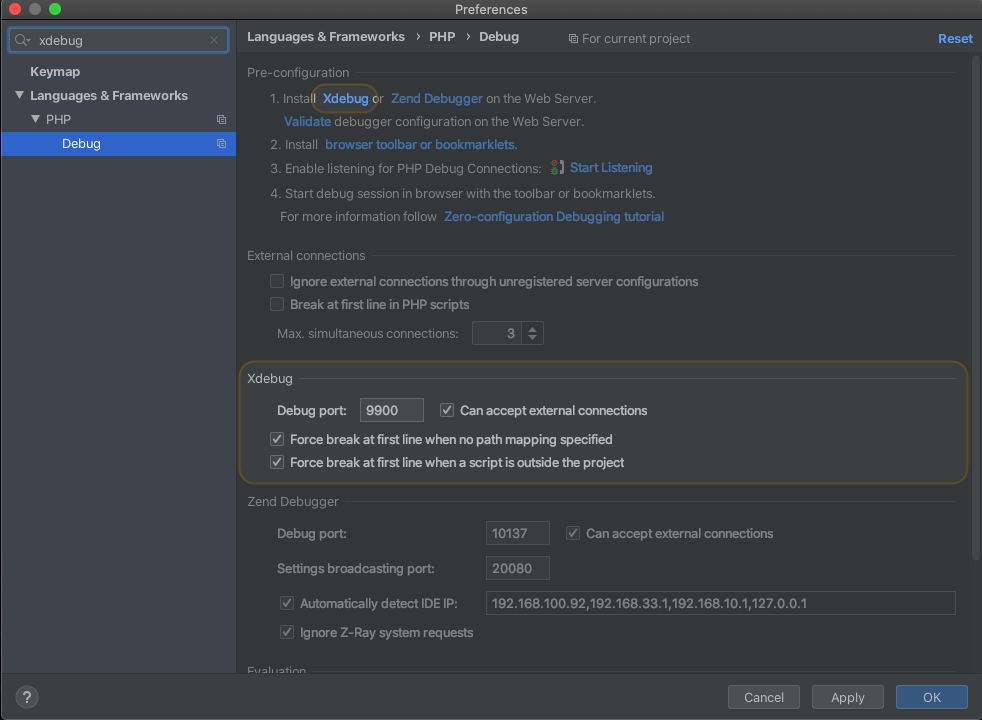
PHPstorm configuration
Deployment configure
phpstorm -> Preference -> Build, Execution, Deployment -> Deployment
add a new remote server by click on [+] icon
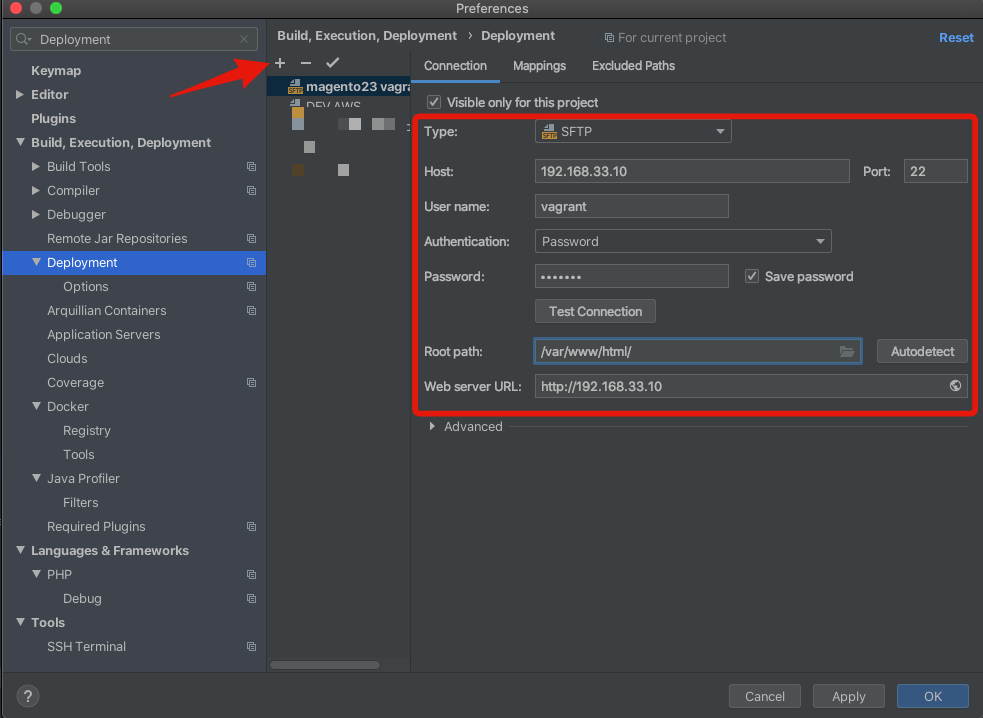
host You can set it to a specific domain or an IP address
username remote server username since we use vagrant username will be vagrant
password remote server password since we use vagrant password will be vagrant
root path vagrant Magento folder absolute location /var/www/html/
Servers configure
PHPSTORM -> Preference -> Languages & Frameworks -> PHP -> Servers
add a new server by click on [+] icon
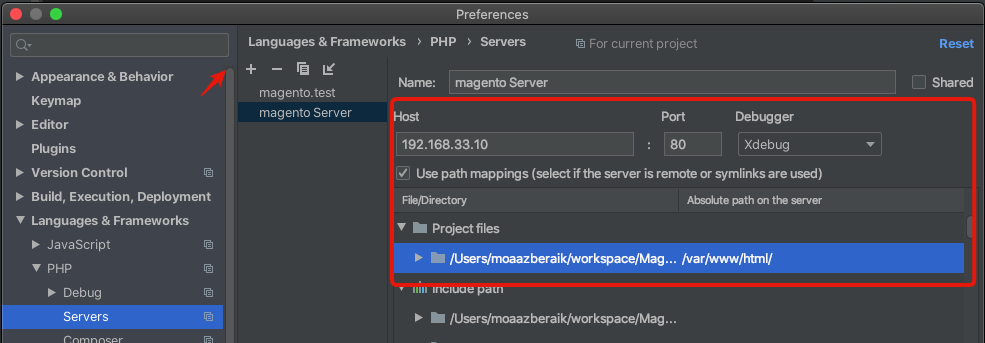
host You can set it to a specific domain or an IP address
Use path mapping check the checkbox
under project files set the vagrant Magento folder absolute location /var/www/html/
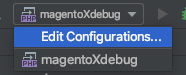
Run/debug configure
PHPSTORM ->Toolbar ->Edit Configurations
- add a new debug by click on [+] icon
- select PHP Remote Debug
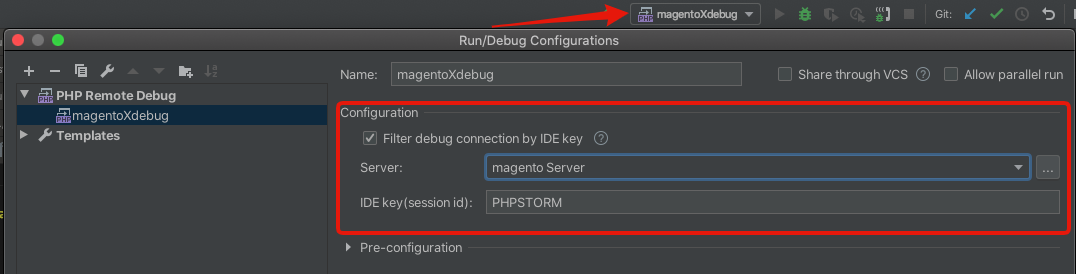
Server selected Server we already create it on the last step.
IDE key you will set the IDE key as you set it in php.ini of xdebug.idekey
Browser Configuration
-
Install xdebug chrome extension Xdebug helper
-
after install extension set IDE key
- on
chrome -> toolbar-> xdebug chrome extension iconright click
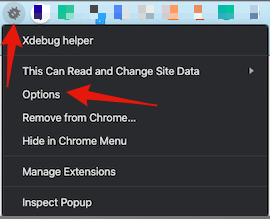
2.selectPhpstormset IDE key you will set the IDE key as you set it inphp.iniofxdebug.idekey
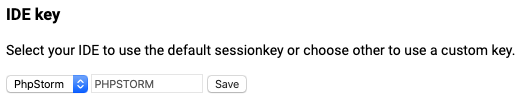
3.click onsavebutton - on
-
enable xdebug chrome extension
-
on
chrome -> toolbar-> xdebug chrome extension iconleft click

- click on
debug
debug Time!
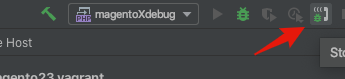
PHPSTORM -> toolbar
-
On the PhpStorm toolbar, toggle the Start Listening for PHP Debug Connections button to start listening for incoming PHP debug connections, or choose Run | Start Listening for PHP Debug Connections from the main menu.
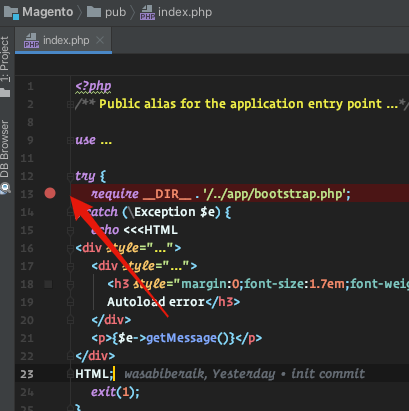
-
Set a breakpoint in your code. Breakpoints can be set in the PHP context inside we set on Magento
pub/index.php
3.on browser refresh website it automatically redirects to PHPstorm
https://gyazo.com/c11de6afa9e6b666a5ff3ef7b983a37d