はじめに
プロジェクト管理に欠かせないWBS(Work Breakdown Structure)とガントチャート。これらを手作業で作成するのは意外と面倒です。
本記事では、ExcelのVBAを使ってWBSとガントチャートを自動作成する方法を解説します。簡潔なコードで効率的に作成できるので、ぜひ活用してください!
完成イメージ
以下のようなWBSとガントチャートがExcelに自動作成されます:
準備
- Microsoft Excel(MacまたはWindows)
- VBAエディタを使える状態にする
(Excelの「開発」タブを有効化。方法はこちらをご参照ください)
コード全体
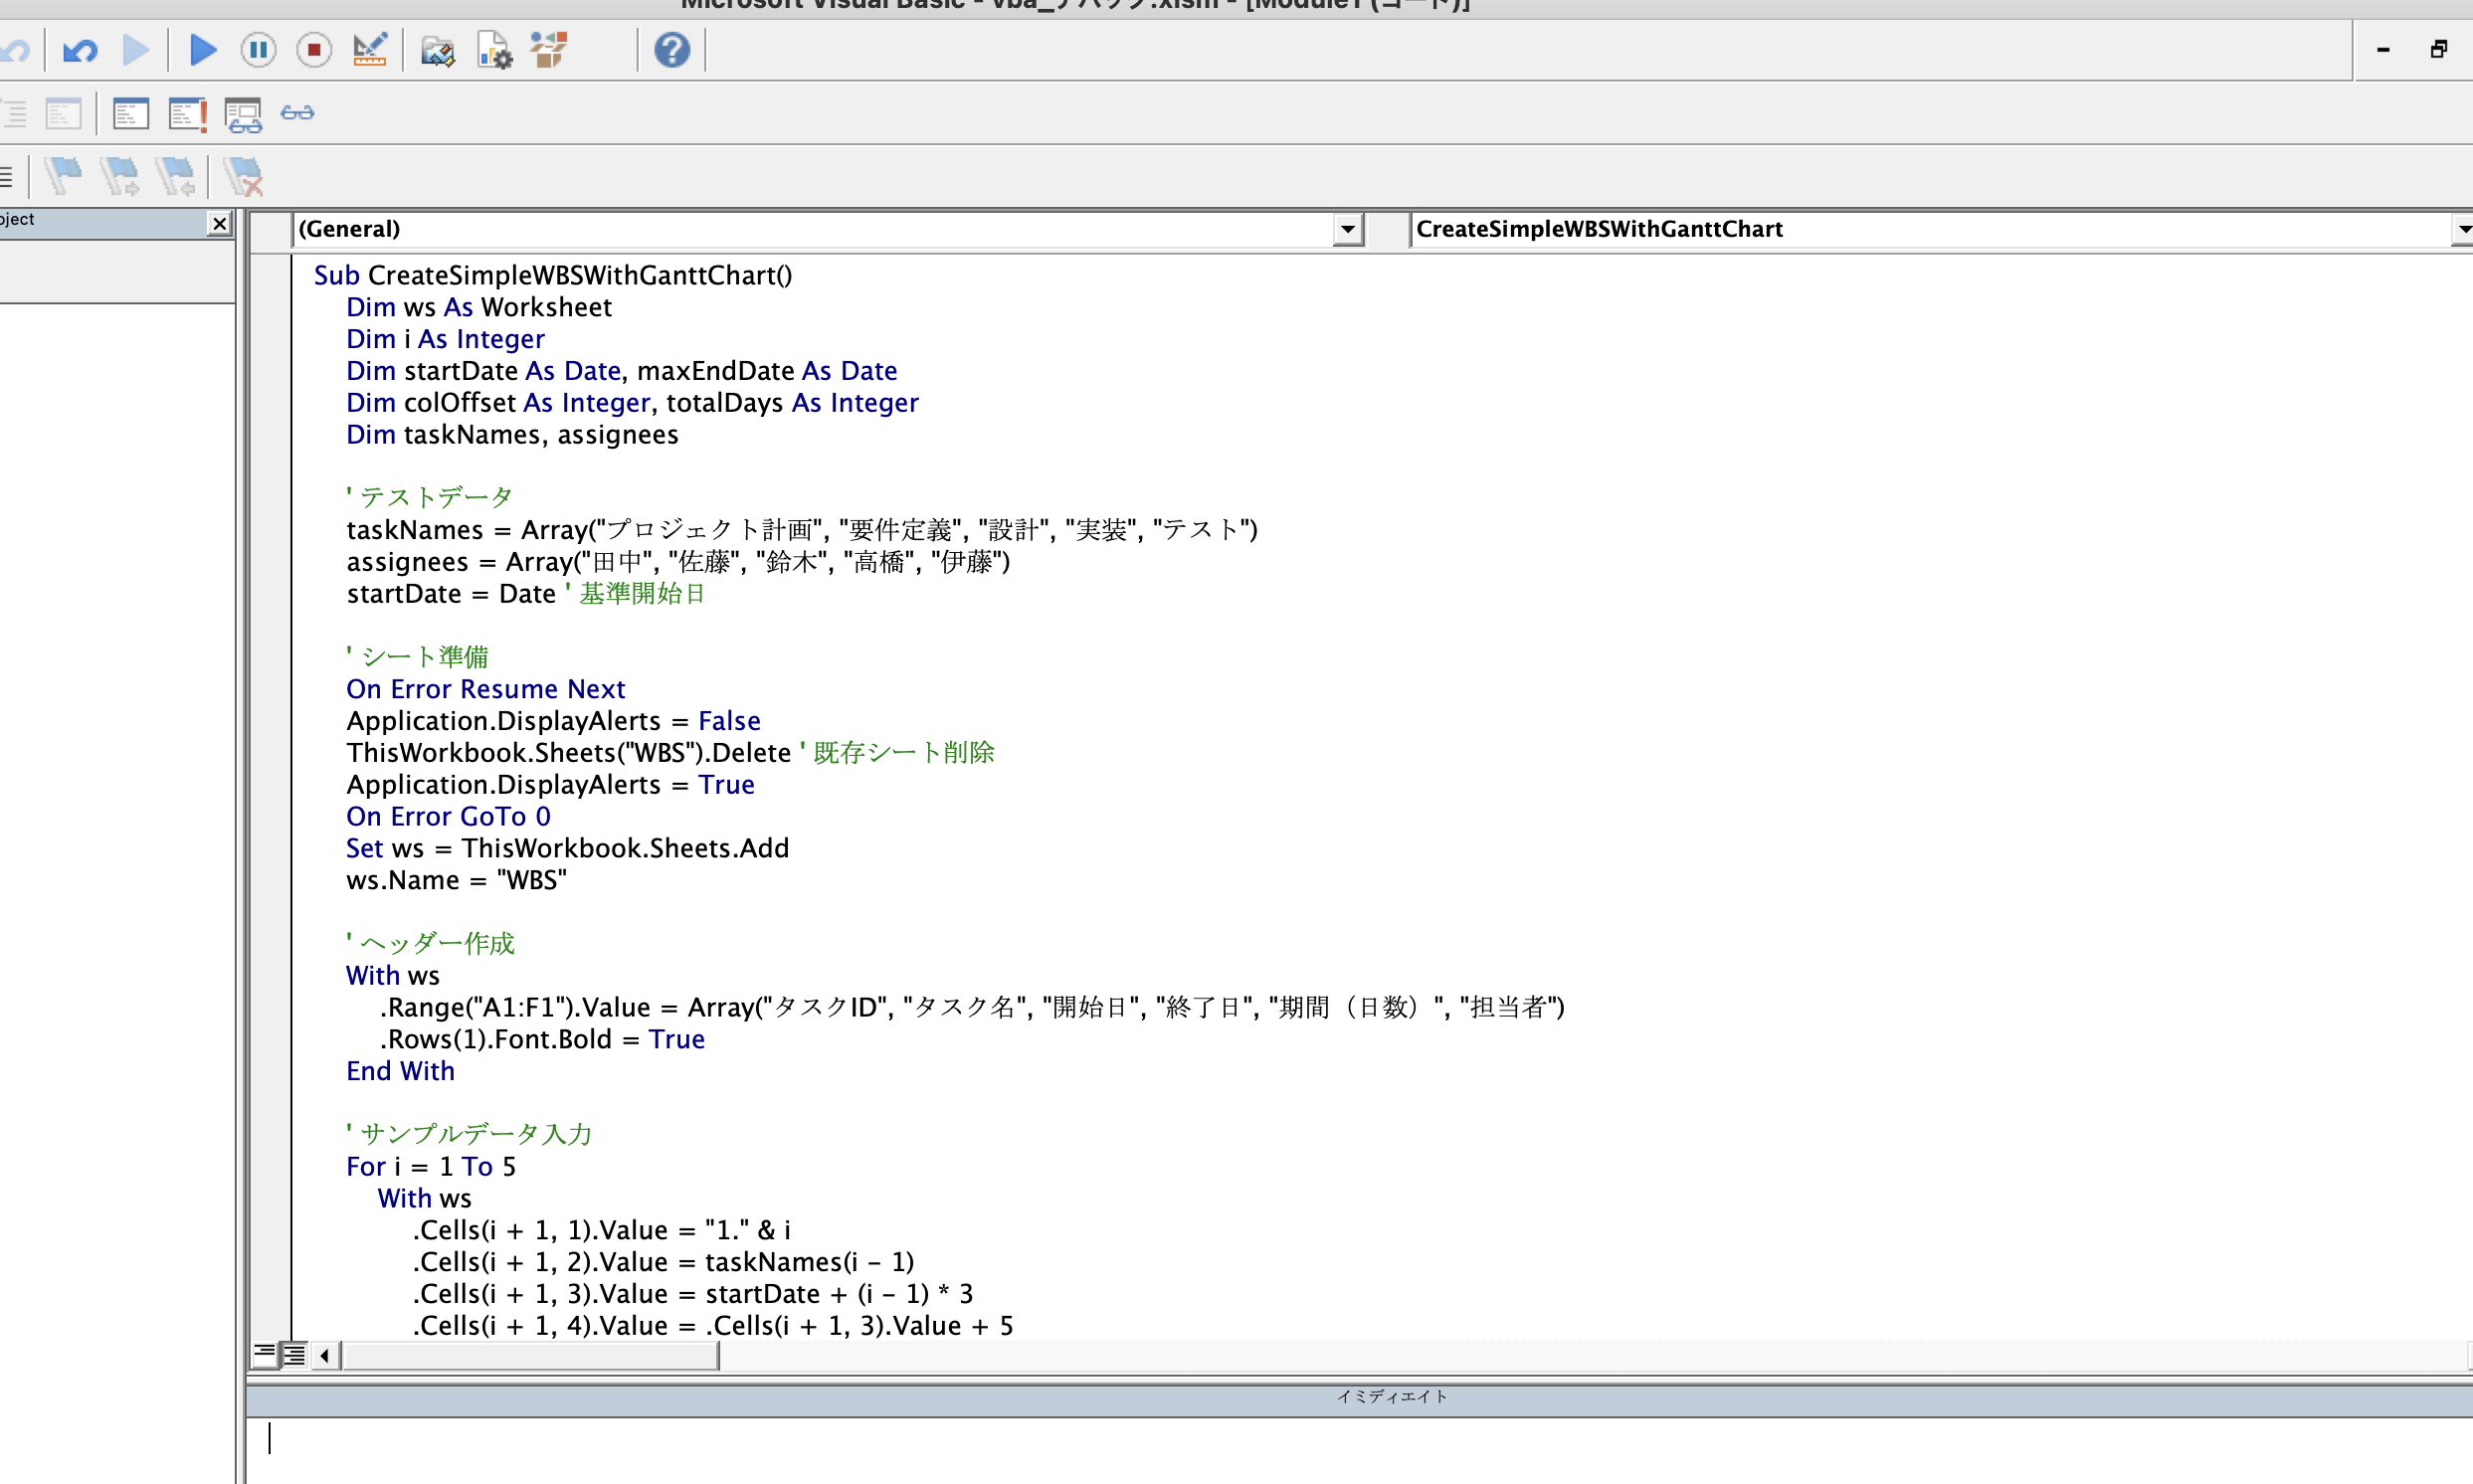
以下のコードをVBAエディタに貼り付けてください。
Sub CreateSimpleWBSWithGanttChart()
    Dim ws As Worksheet
    Dim i As Integer
    Dim startDate As Date, maxEndDate As Date
    Dim colOffset As Integer, totalDays As Integer
    Dim taskNames, assignees

    ' テストデータ
    taskNames = Array("プロジェクト計画", "要件定義", "設計", "実装", "テスト")
    assignees = Array("田中", "佐藤", "鈴木", "高橋", "伊藤")
    startDate = Date ' 基準開始日

    ' シート準備
    On Error Resume Next
    Application.DisplayAlerts = False
    ThisWorkbook.Sheets("WBS").Delete ' 既存シート削除
    Application.DisplayAlerts = True
    On Error GoTo 0
    Set ws = ThisWorkbook.Sheets.Add
    ws.Name = "WBS"

    ' ヘッダー作成
    With ws
        .Range("A1:F1").Value = Array("タスクID", "タスク名", "開始日", "終了日", "期間(日数)", "担当者")
        .Rows(1).Font.Bold = True
    End With

    ' サンプルデータ入力
    For i = 1 To 5
        With ws
            .Cells(i + 1, 1).Value = "1." & i
            .Cells(i + 1, 2).Value = taskNames(i - 1)
            .Cells(i + 1, 3).Value = startDate + (i - 1) * 3
            .Cells(i + 1, 4).Value = .Cells(i + 1, 3).Value + 5
            .Cells(i + 1, 5).FormulaR1C1 = "=R[0]C[-1]-R[0]C[-2]"
            .Cells(i + 1, 6).Value = assignees(i - 1)
            If .Cells(i + 1, 4).Value > maxEndDate Then maxEndDate = .Cells(i + 1, 4).Value
        End With
    Next i

    ' ガントチャート準備
    colOffset = 7
    totalDays = maxEndDate - startDate + 1

    ' 日付ヘッダーをループで入力
    For i = 0 To totalDays - 1
        ws.Cells(1, colOffset + i).Value = startDate + i
        ws.Cells(1, colOffset + i).NumberFormat = "yyyy/mm/dd"
        ws.Columns(colOffset + i).ColumnWidth = 12
    Next i

    ' ガントチャート描画
    For i = 2 To 6
        For j = ws.Cells(i, 3).Value To ws.Cells(i, 4).Value
            ws.Cells(i, colOffset + (j - startDate)).Interior.Color = RGB(0, 176, 80)
        Next j
    Next i

    ' 自動調整
    ws.Columns("A:F").AutoFit
    MsgBox "WBSとガントチャートが作成されました!", vbInformation
End Sub
コードのポイント
-
シートの初期化
- 既存の「WBS」シートがある場合は削除して新規作成。
ThisWorkbook.Sheets("WBS").Delete
- 既存の「WBS」シートがある場合は削除して新規作成。
-
サンプルデータの入力
- タスクのID、開始日、終了日、期間を計算して入力します。
ws.Cells(i + 1, 3).Value = startDate + (i - 1) * 3
ws.Cells(i + 1, 4).Value = .Cells(i + 1, 3).Value + 5
- タスクのID、開始日、終了日、期間を計算して入力します。
-
ガントチャートの日付ヘッダー
-
Forループで日付を入力し、フォーマットを整えます。For i = 0 To totalDays - 1 ws.Cells(1, colOffset + i).Value = startDate + i ws.Cells(1, colOffset + i).NumberFormat = "yyyy/mm/dd" Next i
-
-
ガントチャート描画
- タスク期間に該当するセルを緑色で塗りつぶします。
For j = ws.Cells(i, 3).Value To ws.Cells(i, 4).Value
    ws.Cells(i, colOffset + (j - startDate)).Interior.Color = RGB(0, 176, 80)
Next j
- タスク期間に該当するセルを緑色で塗りつぶします。
実行手順
-
VBAエディタでコードを追加
- Alt + F11でVBAエディタを開き、新しいモジュールを作成。
- 上記のコードを貼り付けます。
-
マクロを実行
- 開発タブ → 「マクロの実行」で
CreateSimpleWBSWithGanttChartを選択して実行します。
- 開発タブ → 「マクロの実行」で
まとめ
このコードを使えば、プロジェクト管理の効率が格段に向上します。手動での入力が不要になり、作業ミスを防ぐことができます。ぜひ試してみてください!

