はじめに
前回の記事 Apache Camelでサーキットブレーカーパターンで、Hystrixを試してみました。
Hystrixではサーキットの状態をグラフィカルに表示できるDashboardがあるので、今回はそれを動かしてみます。
Apache+Spring Bootの組み合わせではHystrix DashboardをSpring Cloud Netflixコンポーネントを使用して動かせるようです。
ただし、今回はSpring Bootを使用しないので、スタンドアロンアプリケーションでHystrix Dashboardを動かしてみます。
アプリケーションでHyrixのMetricsを出力する
hystrix-metrics-event-streamを使用して、アプリケーションからHyrixのMetricsを出力できるようにします。
まずは、以下のライブラリを追加します(Mavenの場合)。
<dependency>
    <groupId>com.netflix.hystrix</groupId>
    <artifactId>hystrix-metrics-event-stream</artifactId>
    <version>1.5.18</version>
</dependency>
アプリケーションにjettyを組み込み、hystrix-metrics-event-streamを利用できるようにします。
URLは「http://localhost:8090/hystrix.stream」にしています。
import org.eclipse.jetty.server.Server;
import org.eclipse.jetty.servlet.ServletContextHandler;
import org.eclipse.jetty.servlet.ServletHolder;

import com.netflix.hystrix.contrib.metrics.eventstream.HystrixMetricsStreamServlet;

~省略~

			Server server = new Server(8090);
			ServletContextHandler servletContext = new ServletContextHandler(ServletContextHandler.NO_SESSIONS);
			server.setHandler(servletContext);
			final HystrixMetricsStreamServlet servlet = new HystrixMetricsStreamServlet();
			final ServletHolder holder = new ServletHolder(servlet);
			servletContext.addServlet(holder, "/hystrix.stream");
			server.start();
スタンドアロン版のHystrix Dashboardのダウンロードと起動
まず、以下のページにアクセスし、Hystrix Dashboardスタンドアロン版のjarファイルをダウンロードします。
2019年1月時点では1.5.6が最新バージョンでした。
ダウンロードしたファイルは"standalone-hystrix-dashboard-1.5.6-all.jar"になります。
ダウンロード後、以下のコマンドを実行して、Hystrix Dashboardを起動します。
>java -jar standalone-hystrix-dashboard-1.5.6-all.jar
21:13:03.272 [vert.x-eventloop-thread-0] INFO  c.g.k.h.c.s.d.HystrixDashboardVerticle - Initializing the HystrixDashboardVerticle instance 1
21:13:03.571 [vert.x-eventloop-thread-0] INFO  c.g.k.h.c.s.d.HystrixDashboardVerticle - Compression support enabled: true
21:13:03.901 [vert.x-eventloop-thread-0] INFO  c.g.k.h.c.s.d.HystrixDashboardVerticle - Listening on port: 7979
21:13:03.901 [vert.x-eventloop-thread-0] INFO  c.g.k.h.c.s.d.HystrixDashboardVerticle - Access the dashboard in your browser: http://localhost:7979/hystrix-dashboard/
21:13:03.902 [vert.x-eventloop-thread-1] INFO  i.v.c.i.l.c.VertxIsolatedDeployer - Succeeded in deploying verticle
Hystrix DashboardにアクセスするためのURLは以下になります。
アクセスすると次の画面が表示されます。
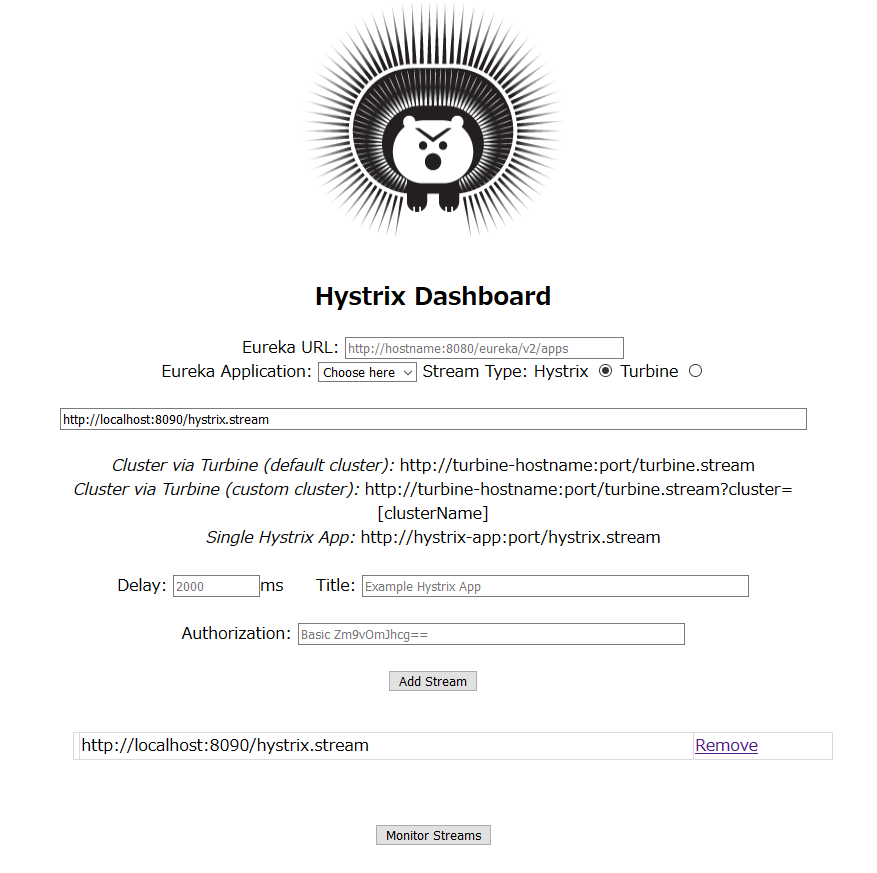
画面が表示された後、「Eureka Application~」という文章が表示された下のテキストボックスに、「http://localhost:8090/hystrix.stream」と入力し、「Add Stream」ボタンをクリックします。
次に「Monitor Streams」ボタンをクリックすると、以下の画面に遷移します。
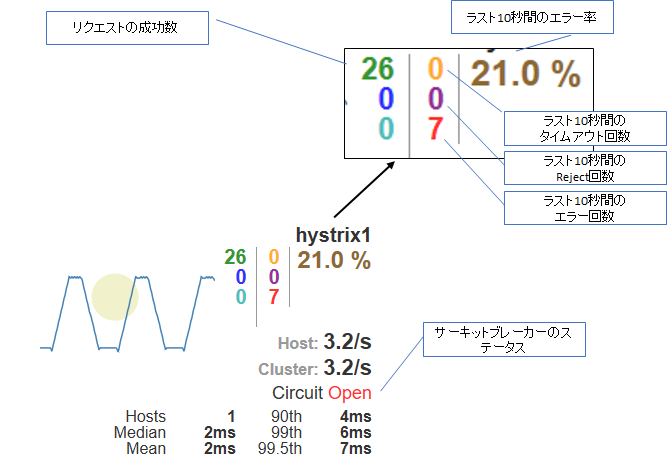
エラー率が50%を超えると、「Circuit」がOpenになるように設定しています。
グラフの読み方は以下のとおりです。