Arthas(アーサス)
Alibaba ArthasはJavaアプリケーションの監視、プロファイリングなどができるツールです。監視対象のアプリケーションの設定変更や再起動なしに利用できるのが特徴です。
Arthasではできることがたくさんあって、これまで一部の機能だけ使っていたのですが、改めて調べてみると様々なことができることが分かったので紹介がてらに触ってみたいと思います。
インストールと実行
Arthasのインストールと実行は以下のコマンドを実行するだけです(Linuxの場合)。
Arthas自体はjavaアプリケーションですので、他の環境でも動かすことができます。
$ curl -O https://arthas.aliyun.com/arthas-boot.jar
$ java -jar arthas-boot.jar
[INFO] arthas-boot version: 3.4.0
[INFO] Found existing java process, please choose one and input the serial number of the process, eg : 1. Then hit ENTER.
* [1]: 631 org.logstash.Logstash
  [2]: 3834 camel-springboot-rest-test-0.0.1-SNAPSHOT.jar
下の2行で起動中のjavaアプリケーションが表示されるので、監視対象のプロセスを入力します。
2 ★今回は"2"を入力
[INFO] arthas home: /root/.arthas/lib/3.4.1/arthas
[INFO] Try to attach process 3834
[INFO] Attach process 3834 success.
[INFO] arthas-client connect 127.0.0.1 3658
  ,---.  ,------. ,--------.,--.  ,--.  ,---.   ,---.
 /  O  \ |  .--. ''--.  .--'|  '--'  | /  O  \ '   .-'
|  .-.  ||  '--'.'   |  |   |  .--.  ||  .-.  |`.  `-.
|  | |  ||  |\  \    |  |   |  |  |  ||  | |  |.-'    |
`--' `--'`--' '--'   `--'   `--'  `--'`--' `--'`-----'


wiki      https://arthas.aliyun.com/doc
tutorials https://arthas.aliyun.com/doc/arthas-tutorials.html
version   3.4.1
pid       3834
time      2020-09-12 01:17:02
ダッシュボード
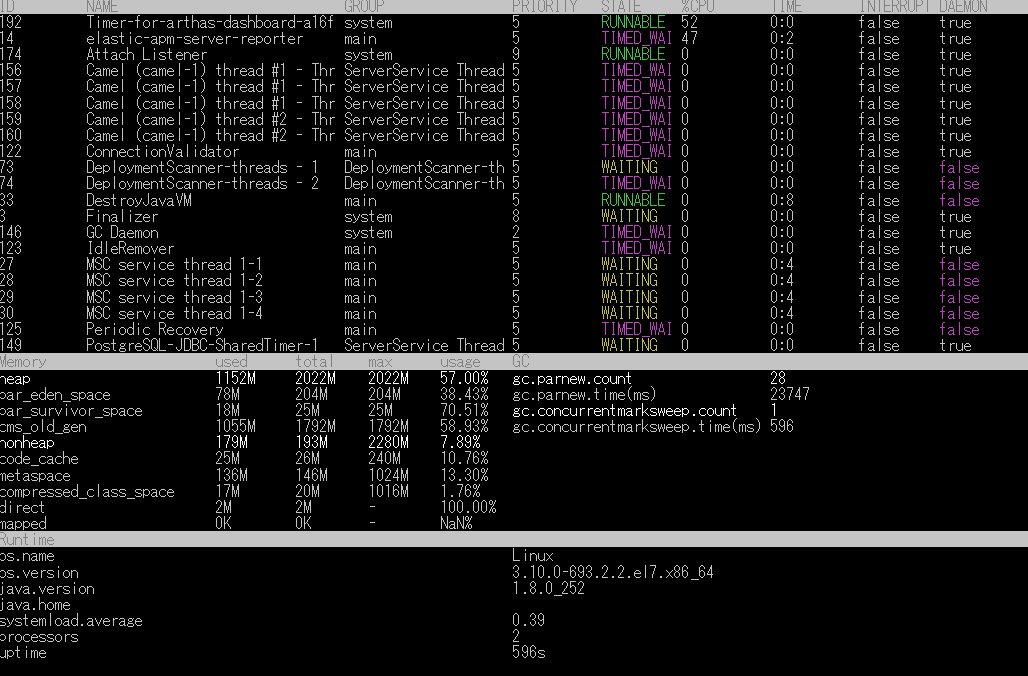
dashboardコマンドで、javaアプリケーションのスレッド一覧、ヒープの使用状況等が表示できるダッシュボードを実行できます。
終了するには"q"を押します。
[arthas@3834]$ dashboard
スレッド
threadコマンドでスレッドの一覧を表示できます。
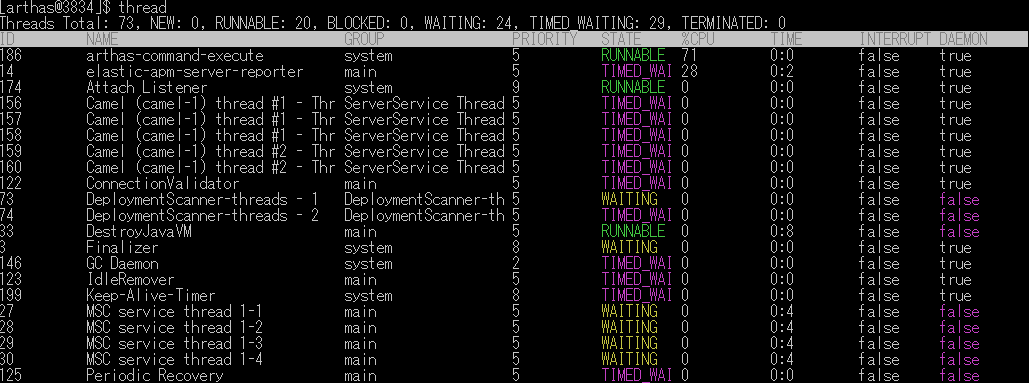
先ほどの一覧から[スレッドID]を用いて、特定のスレッドの情報を表示できます。
[arthas@3834]$ thread 156
"Camel (camel-1) thread #1 - ThroughputLogger" Id=156 TIMED_WAITING on java.util.concurrent.locks.AbstractQueuedSynchronizer$ConditionObject@74abfe92
    at sun.misc.Unsafe.park(Native Method)
    -  waiting on java.util.concurrent.locks.AbstractQueuedSynchronizer$ConditionObject@74abfe92
    at java.util.concurrent.locks.LockSupport.parkNanos(LockSupport.java:215)
    at java.util.concurrent.locks.AbstractQueuedSynchronizer$ConditionObject.awaitNanos(AbstractQueuedSynchronizer.java:2078)
    at java.util.concurrent.ScheduledThreadPoolExecutor$DelayedWorkQueue.take(ScheduledThreadPoolExecutor.java:1093)
    at java.util.concurrent.ScheduledThreadPoolExecutor$DelayedWorkQueue.take(ScheduledThreadPoolExecutor.java:809)
    at java.util.concurrent.ThreadPoolExecutor.getTask(ThreadPoolExecutor.java:1074)
    at java.util.concurrent.ThreadPoolExecutor.runWorker(ThreadPoolExecutor.java:1134)
    at java.util.concurrent.ThreadPoolExecutor$Worker.run(ThreadPoolExecutor.java:624)
    at java.lang.Thread.run(Thread.java:748)
スタックトレースを表示する
メソッドのスタックトレースを表示します。
stack [クラス] [メソッド]
※クラスとメソッドには*[アスタリスク]も使用できます。
該当のメソッドが実行されるたびに以下のようにスタックトレースが表示されます。
[arthas@4939]$ stack mkyz08.example.HelloRestController hello
Press Q or Ctrl+C to abort.
Affect(class count: 1 , method count: 1) cost in 29 ms, listenerId: 5
ts=2020-09-12 01:47:58;thread_name=http-nio-8080-exec-8;id=18;is_daemon=true;priority=5;TCCL=org.springframework.boot.web.embedded.tomcat.TomcatEmbeddedWebappClassLoader@710f4dc7
    @mkyz08.example.HelloRestController.hello()
        at sun.reflect.NativeMethodAccessorImpl.invoke0(NativeMethodAccessorImpl.java:-2)
        at sun.reflect.NativeMethodAccessorImpl.invoke(NativeMethodAccessorImpl.java:62)
        at sun.reflect.DelegatingMethodAccessorImpl.invoke(DelegatingMethodAccessorImpl.java:43)
        at java.lang.reflect.Method.invoke(Method.java:498)
        at org.springframework.web.method.support.InvocableHandlerMethod.doInvoke(InvocableHandlerMethod.java:215)
        at org.springframework.web.method.support.InvocableHandlerMethod.invokeForRequest(InvocableHandlerMethod.java:142)
        at org.springframework.web.servlet.mvc.method.annotation.ServletInvocableHandlerMethod.invokeAndHandle(ServletInvocableHandlerMethod.java:102)
表示回数を制限する場合は以下のように実行します。
stack [クラス] [メソッド] -n [実行回数]
メソッドの実行をモニタリング
メソッドの戻り値、例外、パラメーターなどの情報をモニタリングします。
watchコマンドで実行できます。
watch [クラス] [メソッド] [他のオプション]
"{params,returnObj}"で実行後の戻り値、パラメーターを表示します。
"-x 2"は表示の深さです。
[arthas@4939]$ watch mkyz08.example.HelloRestController hello "{params,returnObj}" -x 2
Press Q or Ctrl+C to abort.
Affect(class count: 1 , method count: 1) cost in 35 ms, listenerId: 19
ts=2020-09-12 05:24:36; [cost=1.155725ms] result=@ArrayList[
    @Object[][
        @String[hoge],
    ],
    @String[Hello World],
]
"{params,returnObj} -b"でメソッド実行前の戻り値、パラメーターを表示します。
戻り値は指定していますが、実行前なので必ずnullになります。
[arthas@4939]$ watch mkyz08.example.HelloRestController hello "{params,returnObj}" -x 2 -b
Press Q or Ctrl+C to abort.
Affect(class count: 1 , method count: 1) cost in 36 ms, listenerId: 20
ts=2020-09-12 05:25:06; [cost=0.03669ms] result=@ArrayList[
    @Object[][
        @String[hoge],
    ],
    null,
]
ログレベルの変更
loggerコマンドでロガーの情報を表示します。
[arthas@4939]$ logger
 name                  ROOT
 class                 ch.qos.logback.classic.Logger
 classLoader           org.springframework.boot.loader.LaunchedURLClassLoader@685f4c2e
 classLoaderHash       685f4c2e
 level                 INFO
 effectiveLevel        INFO
 additivity            true
 codeSource            jar:file:/root/camel-springboot-rest-test-0.0.1-SNAPSHOT.jar!/BOOT-INF/lib/logback-classic-1.2.3.jar!/
 appenders             name            CONSOLE
                       class           ch.qos.logback.core.ConsoleAppender
                       classLoader     org.springframework.boot.loader.LaunchedURLClassLoader@685f4c2e
                       classLoaderHash 685f4c2e
                       target          System.out
以下のコマンドでログレベルを変更することができます。
$ logger --name ROOT --level DEBUG
Update logger level success.
Spring-Bootの場合は"-c"でクラスローダーを指定する必要がありました。
$ logger --name ROOT --level DEBUG -c 685f4c2e
Update logger level success.
MBeanの情報を表示する
mbeanコマンドでMBeanの情報を表示することができます。
[arthas@4939]$ mbean org.apache.camel:context=MyCamelRestApp,type=routes,* ExchangesCompleted
 OBJECT_NAME         org.apache.camel:context=MyCamelRestApp,type=routes,name="hello world route"
--------------------------------------------------------------------------------------------------
 NAME                VALUE
--------------------------------------------------------------------------------------------------
 ExchangesCompleted  78
ヒープダンプを取得する
heapdumpコマンドでヒープダンプを取得することができます。
[arthas@4939]$ heapdump /tmp/dump.hprof
Dumping heap to /tmp/dump.hprof ...
Heap dump file created
"--live"を指定するとヒープダンプ取得前にFullGCが実行されます。
[arthas@4939]$ heapdump --live /tmp/dump_live.hprof
Dumping heap to /tmp/dump_live.hprof ...
Heap dump file created
async-profiler
async-profilerを使って アプリケーションにプロファイラをかけてみます。
[arthas@4939]$ profiler start
Started [cpu] profiling

# サンプルデータの取得件数を確認する
[arthas@4939]$ profiler getSamples
2

# プロファイラーのステータスを確認する
[arthas@4939]$ profiler status
[perf] profiling is running for 19 seconds

[arthas@4939]$ profiler stop
OK
profiler output file: /root/arthas-output/20200912-022458.svg
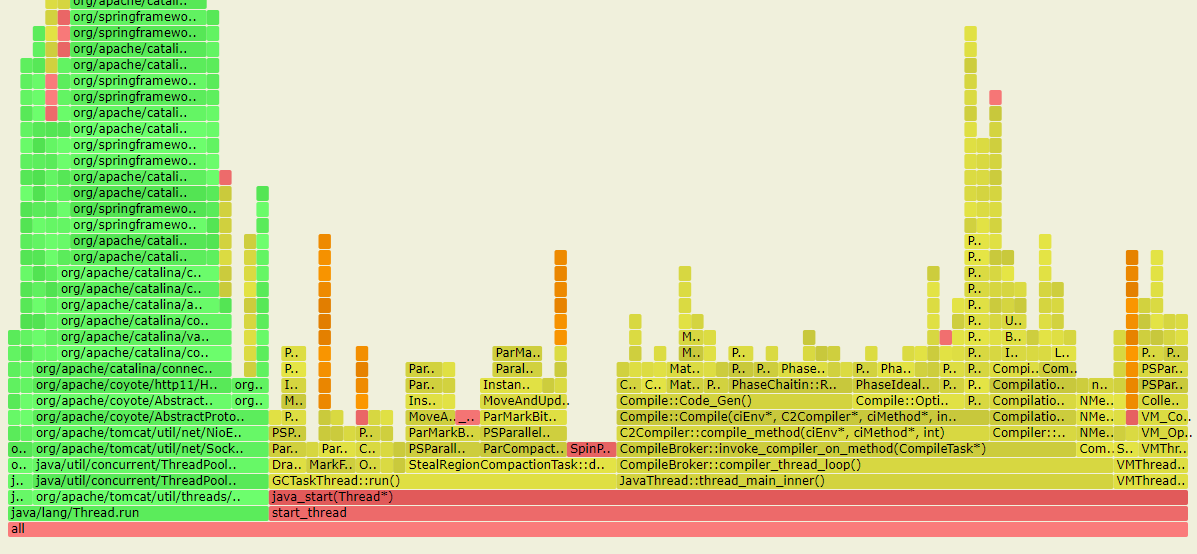
"profiler stop"でプロファイラーを停止させると、SVGファイルが出力されます。HTMLで出力することもできます。
取得されたFlame Graphは以下のとおり。
メソッドの呼び出しをトレースする
traceコマンドでメソッドの呼び出しをトレースすることができます。
トレースには各メソッドの実行時間も表示されるので、どのメソッドが遅いのかを分析するのに使用できます。
[arthas@4939]$ trace mkyz08.example.HelloRestController hello
Press Q or Ctrl+C to abort.
Affect(class count: 1 , method count: 1) cost in 72 ms, listenerId: 7
`---ts=2020-09-12 02:11:16;thread_name=http-nio-8080-exec-3;id=13;is_daemon=true;priority=5;TCCL=org.springframework.boot.web.embedded.tomcat.TomcatEmbeddedWebappClassLoader@710f4dc7
    `---[1.01167ms] mkyz08.example.HelloRestController:hello()
        +---[0.130848ms] org.apache.camel.CamelContext:getEndpoint() #26
        `---[0.649678ms] org.apache.camel.ProducerTemplate:sendBody() #27
実行回数を制限する場合は以下のように実行します。
trace [クラス] [メソッド] -n [実行回数]
指定した時間(例では100ms)実行されたメソッドだけ抽出したい場合は以下のように実行します。
trace [クラス] [メソッド] '#cost>100'
traceコマンドだけではないですが、grepコマンドも使用できます。
例えば、パッケージでフィルタリングするような使い方ができます。
[arthas@5716]$ trace mkyz08.example.HelloRestController hello | grep mkyz08
Press Q or Ctrl+C to abort.
    `---[1.459843ms] mkyz08.example.HelloRestController:hello()
        `---[0.066367ms] mkyz08.example.HelloRestController:add() #29
逆コンパイル
jadコマンドでJVMで実行されているバイトコードをソースコードに逆コンパイルすることができます。
trace, stackコマンドで表示されたメソッドのコードを確認したい場合に利用できます。
他にも修正した内容がサーバに適用されているか確認する目的で使用できそうです。
[arthas@4939]$ jad mkyz08.example.HelloRestController

ClassLoader:
+-org.springframework.boot.loader.LaunchedURLClassLoader@685f4c2e
  +-sun.misc.Launcher$AppClassLoader@70dea4e
    +-sun.misc.Launcher$ExtClassLoader@7c6908d7

Location:
file:/root/camel-springboot-rest-test-0.0.1-SNAPSHOT.jar!/BOOT-INF/classes!/

/*
 * Decompiled with CFR.
 *
 * Could not load the following classes:
 *  org.apache.camel.CamelContext
 *  org.apache.camel.Endpoint
 *  org.apache.camel.ProducerTemplate
 *  org.springframework.web.bind.annotation.RequestMapping
 *  org.springframework.web.bind.annotation.RequestMethod
 *  org.springframework.web.bind.annotation.RestController
 */
package mkyz08.example;

import javax.annotation.Resource;
import org.apache.camel.CamelContext;
import org.apache.camel.Endpoint;
import org.apache.camel.ProducerTemplate;
import org.springframework.web.bind.annotation.RequestMapping;
import org.springframework.web.bind.annotation.RequestMethod;
import org.springframework.web.bind.annotation.RestController;

@RestController
@RequestMapping(value={"/spring"})
public class HelloRestController {
    @Resource
    private ProducerTemplate producer = null;
    @Resource
    private CamelContext context;

    @RequestMapping(method={RequestMethod.GET}, value={"/hello"}, produces={"text/plain"})
    public String hello(String msg) {
        Endpoint end = this.context.getEndpoint("seda:hello_world");
        this.producer.sendBody(end, (Object)msg);
        return "Hello World";
    }
}

Affect(row-cnt:1) cost in 505 ms.
クラスを入れ替える
外部のクラスファイルを読み込んで、JVM内のクラスと入れ替えます。
制約事項
・引数、メソッド名、戻り値の変更はできません。
・クラスのフィールドとメソッドを変更、追加、削除はできません。
[arthas@5716]$ redefine /root/HelloRestController.class
redefine success, size: 1, classes:
mkyz08.example.HelloRestController
メソッドの呼び出しを監視する
monitorコマンドでメソッドの実行回数、平均実行時間等を監視します。
monitor [クラス] [メソッド]
実行結果の例は以下のとおり。"-c"オプションで表示間隔(秒)を指定します。
[arthas@5716]$ monitor -c 5 mkyz08.example.HelloRestController hello
Press Q or Ctrl+C to abort.
Affect(class count: 1 , method count: 1) cost in 35 ms, listenerId: 3
 timestamp           class                         method                       total     success   fail      avg-rt(m  fail-rat
                                                                                                              s)        e
---------------------------------------------------------------------------------------------------------------------------------
 2020-09-12 06:40:2  mkyz08.example.HelloRestCont  hello                        1         1         0         0.40      0.00%
 4                   roller

 timestamp           class                         method                       total     success   fail      avg-rt(m  fail-rat
                                                                                                              s)        e
---------------------------------------------------------------------------------------------------------------------------------
 2020-09-12 06:40:2  mkyz08.example.HelloRestCont  hello                        9         9         0         0.97      0.00%
 9                   roller

 timestamp           class                         method                       total     success   fail      avg-rt(m  fail-rat
                                                                                                              s)        e
---------------------------------------------------------------------------------------------------------------------------------
 2020-09-12 06:40:3  mkyz08.example.HelloRestCont  hello                        5         5         0         0.26      0.00%
 4                   roller
VMオプションの表示
[arthas@4939]$ vmoption
 KEY                             VALUE                            ORIGIN                          WRITEABLE
---------------------------------------------------------------------------------------------------------------------------------
 HeapDumpBeforeFullGC            false                            DEFAULT                         true
 HeapDumpAfterFullGC             false                            DEFAULT                         true
 HeapDumpOnOutOfMemoryError      false                            DEFAULT                         true
~略~

# 値を変更する場合

[arthas@4939]$ vmoption PrintGC true
Successfully updated the vm option.
 NAME     BEFORE-VALUE  AFTER-VALUE
------------------------------------
 PrintGC  false         true
その他の基本コマンド
help - ヘルプを表示
cls - 画面をクリア
session - 現在のセッション情報を表示
reset - resets enhanced classes. All enhanced classes will be reset to their original states. When Arthas server closes, all these enhanced classes will be reset too
version - Arthasのバージョンを表示
history - コマンドの実行履歴を表示
quit - Arthasのクライアントを終了
stop - Arthasサーバーを停止
keymap - Arthasのキーボードショートカットを表示
おわりに
今まで色々なツールを使って実行していたことが、Arthasがあればほとんどやれてしまうようになりました。
また、今回紹介したコマンド以外にもたくさんのコマンドがあるので公式サイトで調べてみてください。Webコンソールも面白そうでした。