charts_flutterの使い方
Flutter のパッケージであるcharts_flutterの使い方の忘却録
※※※ 20201014追記 ※※※
このコードを書いている時のcloud_firestoreは0.13.6だが、
現在の最新は0.14.1+3のため、データの取得方法が異なるので、注意
※※※※※※※※※※※※※※※※※※※
開発環境
PC:macOS Catalina
エディター:Visual Studio Code
charts_flutter:0.9.0(2020/8/2現在の最新バージョン)
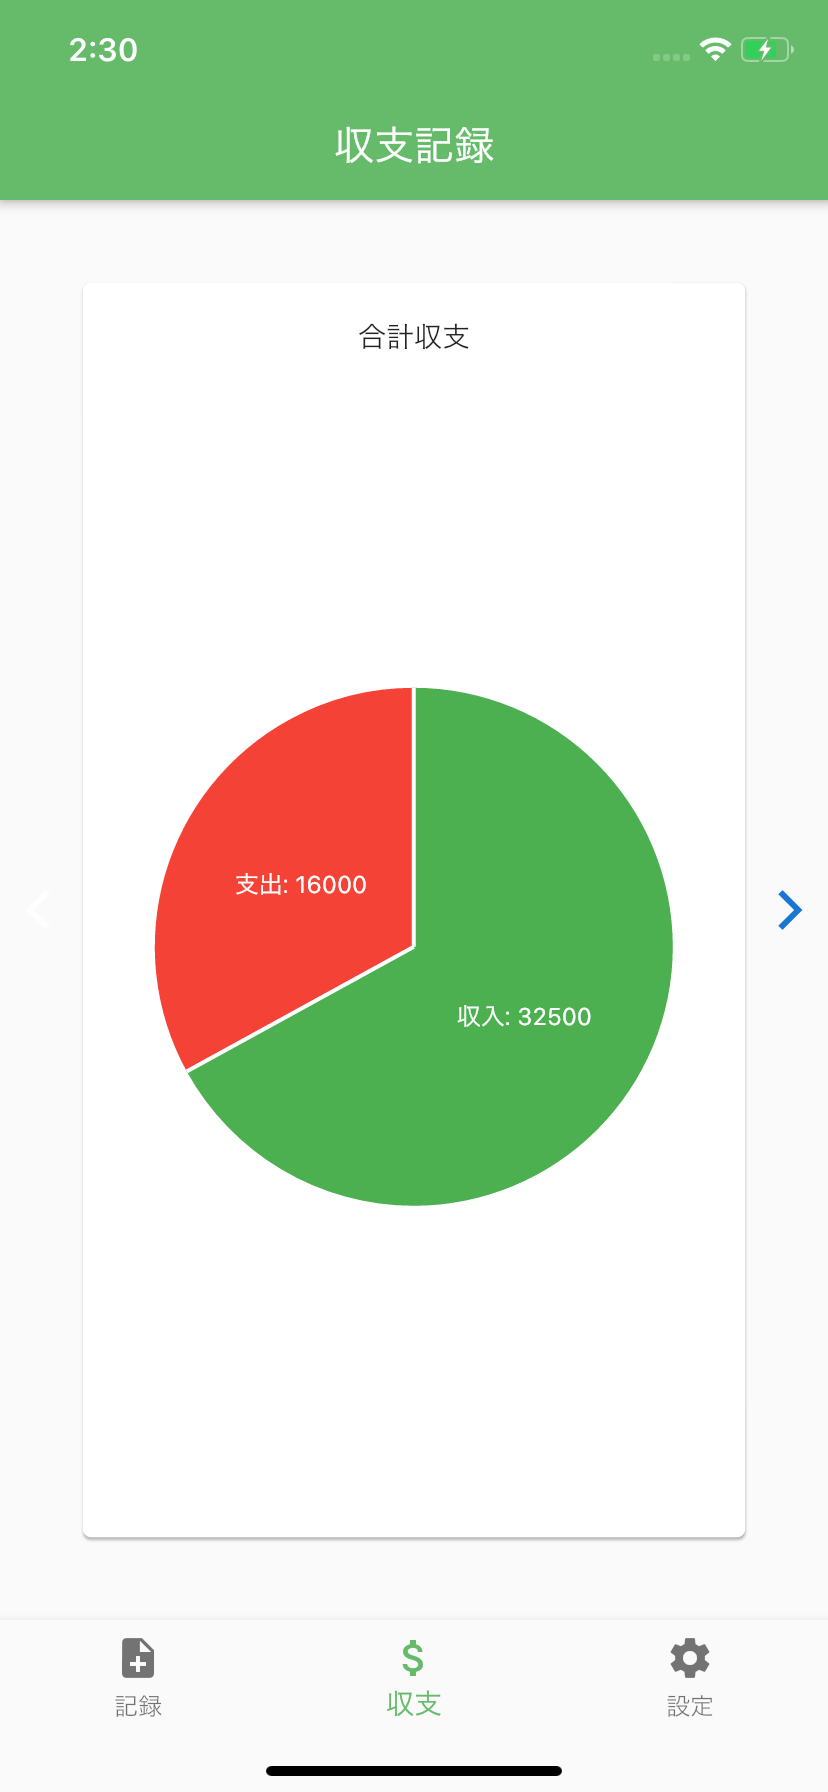
製作物
下記画像のようなチャートを作成
コード
pubspec.yaml
dependencies:
  flutter:
    sdk: flutter
  firebase_core: ^0.4.5
  firebase_auth: ^0.16.1
  cloud_firestore: ^0.13.6
       ・
       ・
       ・
  charts_flutter: ^0.9.0  <- 追加
chart.dart
import 'package:flutter/material.dart';
import 'package:firebase_auth/firebase_auth.dart';
import 'package:cloud_firestore/cloud_firestore.dart';
import 'package:charts_flutter/flutter.dart' as charts;

class BudgetPage extends StatefulWidget {
  BudgetPage({Key key}) : super(key: key);
  @override
  _BudgetPageState createState() => _BudgetPageState();
}

class _BudgetPageState extends State<BudgetPage> {
  final String _collectionName = "users";
  List _productsDataList;
  int _itemCount = 0;
  int _profit = 0;
  int _cost = 0;
  List _profitArray ;
  List _costArray;
  bool _getProfitDataFlg = false;
  List<charts.Series<BudgetChart, String>> _series = [];
  List _pieChartArray = [];

  void _getProfitData() async {
    final QuerySnapshot allcollections = await Firestore.instance.collection(this._collectionName).getDocuments();
    final FirebaseUser user = await FirebaseAuth.instance.currentUser();
    final String userID = user.uid;

    for (int i = 0; i < allcollections.documents.length; i++) {
      Map<String, dynamic> currentUserData = allcollections.documents[i].data;

      if (currentUserData["uid"] == userID) {
        currentUserData.forEach((key, value) {
          if (key == "products") {
            this._productsDataList = value;
            this._itemCount = this._productsDataList.length;
          }
        });
      }
    }

    this._profitArray = List.filled(this._itemCount + 1, 0);
    this._costArray = List.filled(this._itemCount + 1, 0);
    this._pieChartArray = List.generate(this._itemCount + 1, (i)=>null);

    for (int i = 0; i < this._itemCount; i++) {
      List workingData = this._productsDataList[i]["working_data"];
      for (int j = 0; j < workingData.length; j++) {
        this._profit += (workingData[j]["shipment"] * workingData[j]["count"]);
        this._cost += workingData[j]["cost"];
      }

      this._profitArray[i + 1] = this._profit;
      this._costArray[i + 1] = this._cost;

      this._profit = 0;
      this._cost = 0;
    }

    for (int i = 0; i <= this._itemCount; i++) {
      for (int j = 0; j < this._itemCount; j++) {
        this._profitArray[0] += this._profitArray[j + 1];
        this._costArray[0] += this._costArray[j + 1];
      }
      _createChartData(i);
    }
  }

  // チャートデータを作成するメソッド
  void _createChartData(int index) {
    this._series = [
      charts.Series<BudgetChart, String>(
        id: 'BudgetChart',
        domainFn: (BudgetChart record, _) => record.word,
        measureFn: (BudgetChart record, _) => record.money,
        colorFn: (BudgetChart record, _) => record.color,
        data: [
           // BudgetChartのインスタンスを生成
           // 表示する文字、金額、色を指定する
          BudgetChart("収入", _profitArray[index], charts.MaterialPalette.green.shadeDefault),
          BudgetChart("支出", _costArray[index], charts.MaterialPalette.red.shadeDefault),
        ],
     // チャートに表示するラベル
        labelAccessorFn: (BudgetChart row, _) => '${row.word}: ${row.money}',
      ),
    ];
    this._pieChartArray[index] = this._series;

    setState(() {
      _getProfitDataFlg = true;
    });
  }

  // チャートのタイトルを表示するウィジェット
  Widget _titleArea(int index) {

    String titleText;

    if(index == 0){
      titleText = "合計収支";
    } else {
      titleText = this._productsDataList[index - 1]["product"];
    }

    return Container(
      margin: EdgeInsets.all(16.0),
      child: Center(
        child: Text(titleText),
      ),
    );
  }

  // Expandedを使用してチャートサイズを調整して表示するウィジェット
  Widget _showPieChart(int index) {
    return Container(
      child: Expanded(
        child: Container(
          margin: const EdgeInsets.fromLTRB(16.0, 0.0, 16.0, 16.0),
          child: charts.PieChart(this._pieChartArray[index],
            defaultRenderer: charts.ArcRendererConfig(
              arcRendererDecorators: [charts.ArcLabelDecorator()])),
        ),
      ),
    );
  }

  // "<", ">" アイコン表示するウィジェット
  Widget _showIcon(IconData icon, String label, int index) {
    Color color = Theme.of(context).primaryColorDark;

    // 先端と終端のアイコンを非表示
    if (index == 0){
      color = Colors.white70;
    } else if (index == this._itemCount + 1) {
      color = Colors.white70;
    }
    return Icon(icon, color: color);
  }

  _BudgetPageState() {
    _getProfitData();
  }

  @override
  Widget build(BuildContext context) {
    if (!_getProfitDataFlg) {
      return Center(
        child: CircularProgressIndicator(
          valueColor: AlwaysStoppedAnimation<Color>(Colors.green),
        )
      );
    }

    final Size DEVICE_SIZE = MediaQuery.of(context).size;

    return Scaffold(
      appBar: AppBar(
        title: Text("収支記録"),
        backgroundColor: Colors.green[400],
      ),
      body: Container(
        child: PageView(
          scrollDirection: Axis.horizontal,
          // 各タブの内容
          children: [
            for (int i = 0; i <= this._itemCount; i++)
              Row(
                mainAxisAlignment: MainAxisAlignment.spaceEvenly,
                children: <Widget>[
                  _showIcon(Icons.arrow_back_ios, "arrow_back_ios", i),
                  Card(
                    child: Container(
                      width: DEVICE_SIZE.width * 0.8,
                      height: DEVICE_SIZE.height * 0.7,
                      child: Column(
                        children: <Widget>[
                          _titleArea(i),
                          _showPieChart(i),
                        ],
                      ),
                    ),
                  ),
                  _showIcon(Icons.arrow_forward_ios, "arrow_forward_ios", i + 1),
                ]
              ),
          ],
        ),
      )
    );
  }
}

// チャートクラス
class BudgetChart {
  final String word;
  final int money;
  final charts.Color color;

  BudgetChart(this.word, this.money, this.color);
}
参考