※私は感染症に関しては全くの素人です。記事に誤りがあれば指摘をお願いします。また、この記事で生じる損害に関して、私は一切責任を負うつもりはありませんので、あくまで個人利用の参考にお使いください。
はじめに
東京大学理学系研究科生物科学専攻のWebサイトに掲載されていた新型コロナウイルス感染症の流行予測がとても興味深いものだったので、そこで紹介されていたSEIRモデルをRで実装してみました。モデルの詳細はリンク先をご覧ください。R以外の言語でも実装は容易だと思います。
SEIR.R
R0 <- 2.5; l <- 5.0; i <- 10.0; dt <- 1.0
daymax <- 400
Su <- numeric(daymax) # Susceptible
Ex <- numeric(daymax) # Exposed
In <- numeric(daymax) # Infectious
Re <- numeric(daymax) # Recovered
N <- 1.0*10^5 # 10万人
Su[1] <- N; Ex[1] <- 0.0; In[1] <- 1.0; Re[1] <- 0.0
for (day in 1:(daymax-1)) {
print(day)
Su[day+1] <- Su[day] + (-(R0/i)*(Su[day]/N)*In[day])*dt
Ex[day+1] <- Ex[day] + ((R0/i)*(Su[day]/N)*In[day] - (1.0/l)*Ex[day])*dt
In[day+1] <- In[day] + ((1.0/l)*Ex[day] - (1.0/i)*In[day])*dt
Re[day+1] <- Re[day] + ((1.0/i)*In[day])*dt
}
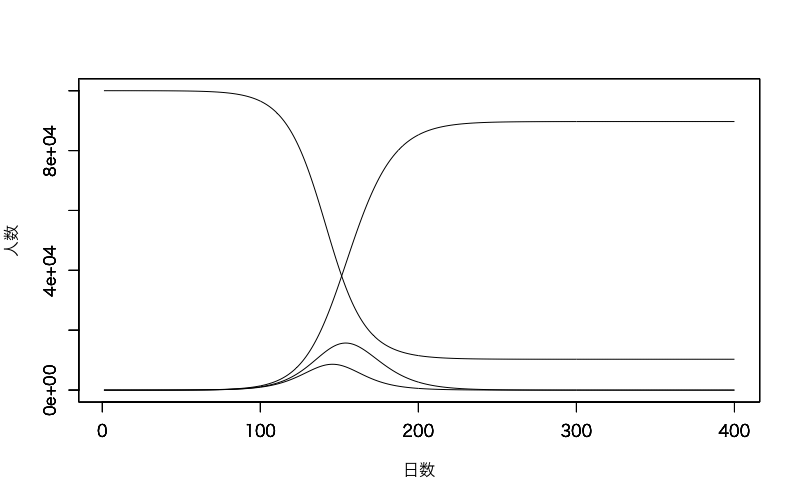
plot(1:daymax, Su, type="l", xlab="日数", ylab="人数", ylim=c(0,N))
par(new=T); plot(1:daymax, Ex, type="l", xlab="", ylab="", ylim=c(0,N))
par(new=T); plot(1:daymax, In, type="l", xlab="", ylab="", ylim=c(0,N))
par(new=T); plot(1:daymax, Re, type="l", xlab="", ylab="", ylim=c(0,N))
結果の図は以下の通り。
その他
時間があれば、上のSEIRモデルを使って色々考察していこうと思います。
東京都の場合の考察(執筆予定)