目的
一般的に, 特異値分解は特異値を降順に並べ替えたとき特異値は一意に定まり, 一方で特異ベクトルは一意に定まらないことが知られている. それは固有ベクトルの選び方が任意であることからである.
さて, 本稿ではMatlabのSVD(特異値分解)のScipyでの再現についての検証を行った. 本稿の比較実験において, Pythonでのscipy.linalg.sparse.svdsはMatlabのsvdsと同じ振る舞いをすることがわかった.
検証の概要
- Matlabのrand関数で生成した$m \times n, m<n$の行列ランダムな行列を生成. ($m=20, n=50$)
データ: Googleスプレッドシートからコピーまたはmatファイルをダウンロード. - Matlabの関数
svdsを用いてSVDを行う. Pythonのscipy.sparse.linalg.svd関数を用いてSVDを行う. この際, 最も大きい特異値とそれに係る特異ベクトルについて比較を行う.- Matlabでは
svds(A,k)により行列Aの最も大きいk個の特異値を得る. - Pythonでは
scipy.sparse.linalg.svds(A, k)により行列Aの特異値/特異ベクトルを降順に得る.
- Matlabでは
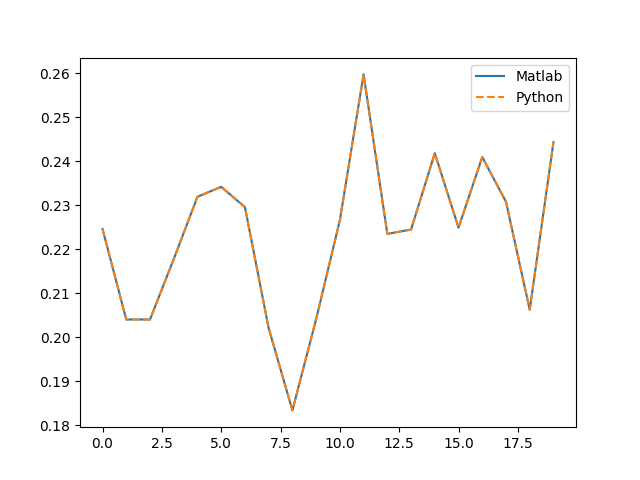
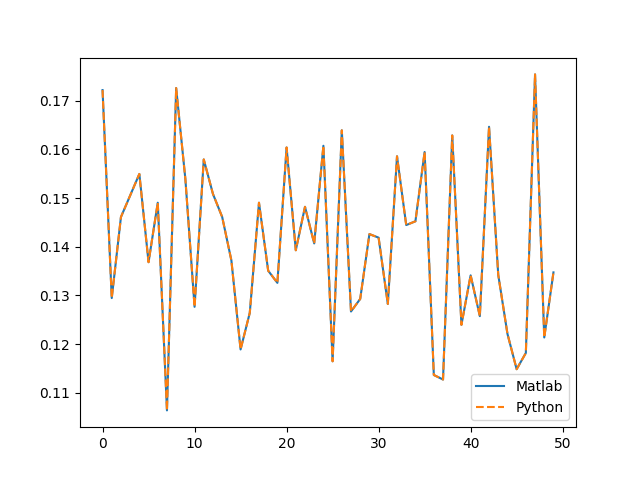
- 出力された特異値, 左特異ベクトル, 右特異ベクトルをプロットして比較する.
コードと出力
Matlab
>> file_name = 'ファイルのある場所/random_mat.mat';
>> file_data = load(file_name);
>> data = file_data.data;
[U S V flag] = svds((data), 1); % SVDのサブセット, 最大特異値の出力を得る
>> U'
  1 列から 12 列
    0.2245    0.2040    0.2040    0.2177    0.2319    0.2341    0.2295    0.2020    0.1833    0.2041    0.2266    0.2597
  13 列から 20 列
    0.2235    0.2244    0.2418    0.2249    0.2409    0.2307    0.2062    0.2443
>> S
S =
   15.3810
>> V'
  1 列から 12 列
    0.1722    0.1295    0.1461    0.1505    0.1550    0.1368    0.1490    0.1064    0.1726    0.1539    0.1277    0.1579
  13 列から 24 列
    0.1508    0.1461    0.1372    0.1189    0.1264    0.1490    0.1351    0.1326    0.1604    0.1393    0.1482    0.1407
  25 列から 36 列
    0.1607    0.1165    0.1639    0.1267    0.1293    0.1426    0.1419    0.1283    0.1586    0.1445    0.1452    0.1595
  37 列から 48 列
    0.1137    0.1127    0.1629    0.1240    0.1341    0.1257    0.1646    0.1342    0.1221    0.1149    0.1182    0.1754
  49 列から 50 列
    0.1214    0.1347
Python
In [1]: import scipy.io as sio
In [2]: file_name = 'ファイルのある場所/random_mat.mat'
In [3]: file_data = sio.loadmat(file_name)
In [4]: data = file_data['data']
In [6]: from scipy.sparse.linalg import svds
In [7]: U, S, Vt = svds(data, k=1)
In [24]: U.T
Out[24]:
array([[ 0.22454768,  0.20398463,  0.20399688,  0.21773078,  0.23189586,
         0.2341432 ,  0.22953628,  0.20200878,  0.18332116,  0.20405905,
         0.22656113,  0.25971253,  0.22345986,  0.22443684,  0.24179597,
         0.22486963,  0.24091711,  0.23074722,  0.2061956 ,  0.24430907]])
In [25]: S
Out[25]: array([ 15.38096087])
In [28]: Vt
Out[28]:
array([[ 0.17217701,  0.12945966,  0.14610378,  0.15052239,  0.15495316,
         0.1368263 ,  0.14904164,  0.10638937,  0.17259396,  0.1539205 ,
         0.12765933,  0.1579254 ,  0.15083483,  0.14612175,  0.13719313,
         0.11890223,  0.12643451,  0.14904031,  0.1350735 ,  0.13258259,
         0.16038814,  0.13927807,  0.14819803,  0.14068011,  0.16073848,
         0.11647424,  0.16391321,  0.12670191,  0.12928473,  0.14260052,
         0.14186614,  0.12825514,  0.15857603,  0.14445415,  0.14522958,
         0.15945624,  0.11366243,  0.11273067,  0.16286158,  0.12396521,
         0.13413132,  0.12574699,  0.16463963,  0.13424388,  0.12212364,
         0.11485005,  0.11818812,  0.17539564,  0.12136569,  0.13473575]])
Matlabの出力をPythonにインポートして出力の比較
Matlabの出力のmatファイル
Pythonの出力のpickleファイル
Pythonのコード
# matlabでの結果のインポート
>> result_name = 'ファイルのある場所/matlab_result.mat'
>> result_file = sio.loadmat(result_name)
>> matlab_U = result_file['U']
>> matlab_S = result_file['S']
>> matlab_V = result_file['V']
# 特異値の比較
In [55]: S[0] - matlab_S
Out[55]: array([[  1.77635684e-15]])
比較
特異値
MatlabとPythonでの誤差が1.77635684e-15であることからほぼ同じであると言って良い.
左特異ベクトル
In [58]: sum((matlab_U - U) ** 2)
Out[58]: array([  1.15524982e-29])
誤差: とても小さいため同じベクトルとみなせる
右特異ベクトル
In [59]: sum((matlab_V - Vt.T) ** 2)
Out[59]: array([  4.45852782e-31])
誤差: とても小さいため同じベクトルとみなせる
結論
- $m \times n, m<n$の行列に対してMatlabとPythonのSVDの出力の比較を行った.
- kを1に指定し同じ行列を入力としたとき, Matlabの
svdsとPythonのscipy.sparse.linalg.svdsは同じ振る舞いをすることがわかった. - MatlabとPythonで同じSVDできるって幸せ♡

