「Go + QML + QChart.js で素敵なチャートを表示する - Goとキュート(Qt)な日々」から転載。
Go と QML と QChart.js を使って素敵なチャートを表示してみます。
QChart.js とは
QChart.js とは、jwintz/qchart.js · GitHubで開発されているQMLでチャートを表示するためのJavaScriptライブラリです。
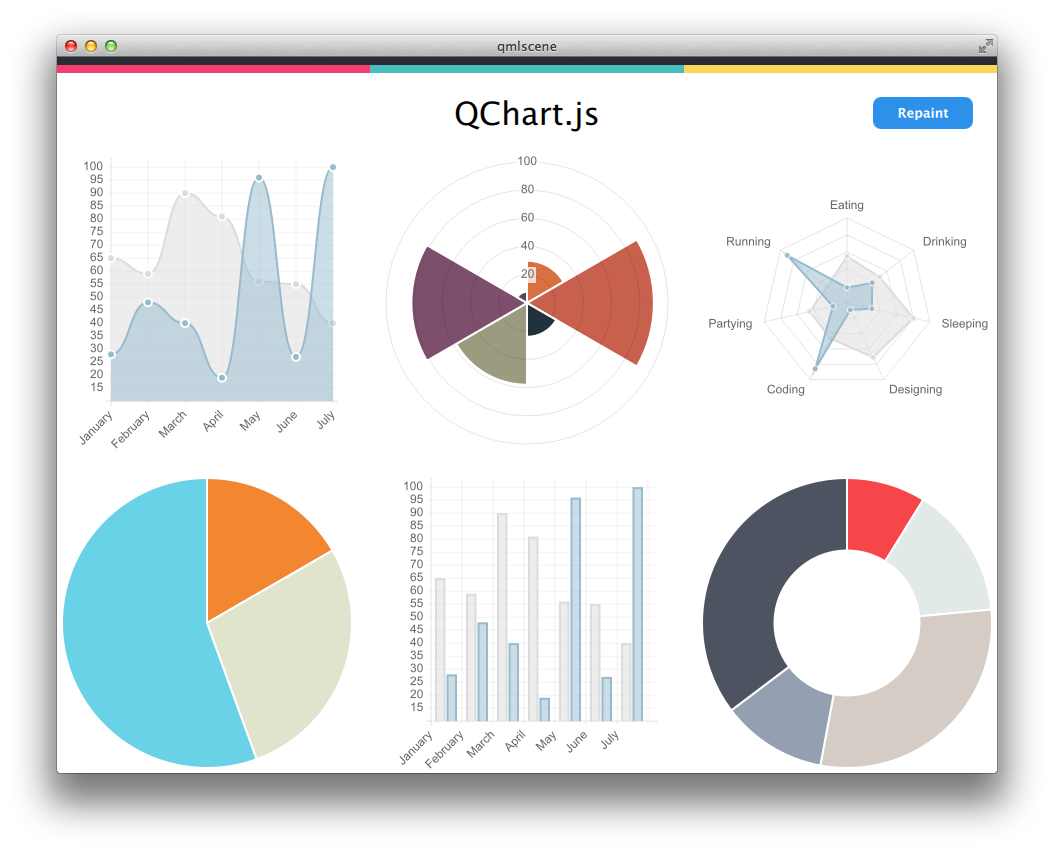
画像はjwintz/qchart.js · GitHubのREADME.mdより引用
環境
- go version go1.5.2 darwin/amd64
- Qt 5.5.1
- OS El Capitan
準備
jwintz/qchart.js · GitHubからQChart.jsのプロジェクトごとダウンロードしてきます。
ドキュメントのSetupの項目では自分のgitプロジェクトにサブモジュールとして追加する方法しか書かれていませんが、単純にzipでダウンロードして問題ありません。
今回はダウンロードしたファイルを展開したのち、展開したディレクトリを"Charts"という名前に便宜上変更しておきましょう。
ディレクトリ構成
goのソースコードと同じディレクトリ下にassetsディレクトリとjbQuickディレクトリを作成し、それぞれにQMLファイルとjwintz/qchart.js · GitHubからダウンロードしてきたzipファイルを展開したものを配置します。
┣main.go ・・・ソースコード
┣assets/
┃┗main.qml・・・QMLファイル
┗jbQuick/
 ┗Charts/ ・・・GitHubからダウンロードしてきたzipファイルを展開したもの
  ┣QChart.js
  ┣QChart.qml
   ・
   ・
   ・
ソースコード
package main

//go:generate genqrc assets jbQuick

import(
    "gopkg.in/qml.v1"
    "fmt"
)

// --------------------------------------------------
// main
// --------------------------------------------------
func main() {
    err := qml.Run(run)
    if nil != err {
        fmt.Println(err)
    }
}

// --------------------------------------------------
// run関数
// --------------------------------------------------
func run() error {
    engine := qml.NewEngine()
    component, err := engine.LoadFile("qrc:///assets/main.qml")
    if err != nil {
        return err
    }

    win := component.CreateWindow(nil)
    win.Show()
    win.Wait()
    return nil
}
import QtQuick 2.0
import QtQuick.Controls 1.4
import jbQuick.Charts 1.0

ApplicationWindow {
    width:  640
    height: 480

    Rectangle {
        anchors.fill: parent
        color: "white"

        Chart {
            id: chart_line;
            width: 640;
            height: 400;
            anchors.centerIn: parent

            chartAnimated: true;
            chartAnimationEasing: Easing.InOutElastic;
            chartAnimationDuration: 2000;
            chartType: Charts.ChartType.LINE;
            Component.onCompleted: {
                chartData = {
                    labels: ["January", "February", "March", "April", "May", "June", "July"],
                    datasets:[
                        {
                            label: "My First dataset",
                            fillColor: "rgba(220,220,220,0.2)",
                            strokeColor: "rgba(220,220,220,1)",
                            pointColor: "rgba(220,220,220,1)",
                            pointStrokeColor: "#fff",
                            pointHighlightFill: "#fff",
                            pointHighlightStroke: "rgba(220,220,220,1)",
                            data: [65, 59, 80, 81, 56, 55, 40]
                        },
                        {
                            label: "My Second dataset",
                            fillColor: "rgba(151,187,205,0.2)",
                            strokeColor: "rgba(151,187,205,1)",
                            pointColor: "rgba(151,187,205,1)",
                            pointStrokeColor: "#fff",
                            pointHighlightFill: "#fff",
                            pointHighlightStroke: "rgba(151,187,205,1)",
                            data: [28, 48, 40, 19, 86, 27, 90]
                        }
                    ]
                }
            }
        }
    }
}
簡単な説明
"main.go"では特に変わったことはしていません。(Go+QMLの基本的な内容に関しては「Go + QML で簡単なカウンタ作成 - Goとキュート(Qt)な日々」を参照してください。)
QChart.jsはパッキングしないと動作しないため、"main.go"に以下の1行を追加します。
//go:generate genqrc assets jbQuick
この1行ではjbQuickディレクトリ下とassetsディレクトリをgenqrcコマンドを用いてパッキングしています。(genqrcについては「Goでバイナリファイルにqmlをパッキングする方法 - Goとキュート(Qt)な日々」を参照してください。)
main.qmlでは「Chart.js | Documentation」の例を参考にラインチャート表示するコードを書いています。
        Chart {
            id: chart_line;
            width: 640;
            height: 400;
            anchors.centerIn: parent

            chartAnimated: true;
            chartAnimationEasing: Easing.InOutElastic;
            chartAnimationDuration: 2000;
            chartType: Charts.ChartType.LINE;
            Component.onCompleted: {
                chartData = {
                    labels: ["January", "February", "March", "April", "May", "June", "July"],
                    datasets:[
                        {
                            label: "My First dataset",
                            fillColor: "rgba(220,220,220,0.2)",
                            strokeColor: "rgba(220,220,220,1)",
                            pointColor: "rgba(220,220,220,1)",
                            pointStrokeColor: "#fff",
                            pointHighlightFill: "#fff",
                            pointHighlightStroke: "rgba(220,220,220,1)",
                            data: [65, 59, 80, 81, 56, 55, 40]
                        },
                        {
                            label: "My Second dataset",
                            fillColor: "rgba(151,187,205,0.2)",
                            strokeColor: "rgba(151,187,205,1)",
                            pointColor: "rgba(151,187,205,1)",
                            pointStrokeColor: "#fff",
                            pointHighlightFill: "#fff",
                            pointHighlightStroke: "rgba(151,187,205,1)",
                            data: [28, 48, 40, 19, 86, 27, 90]
                        }
                    ]
                }
            }
        }
実行結果
main.goのあるディレクトリで、コンソール画面を開き以下を実行します。
go generate
go build
その後、ディレクトリ下に実行ファイルが生成されるので、それを実行すると以下のグラフが表示されます。
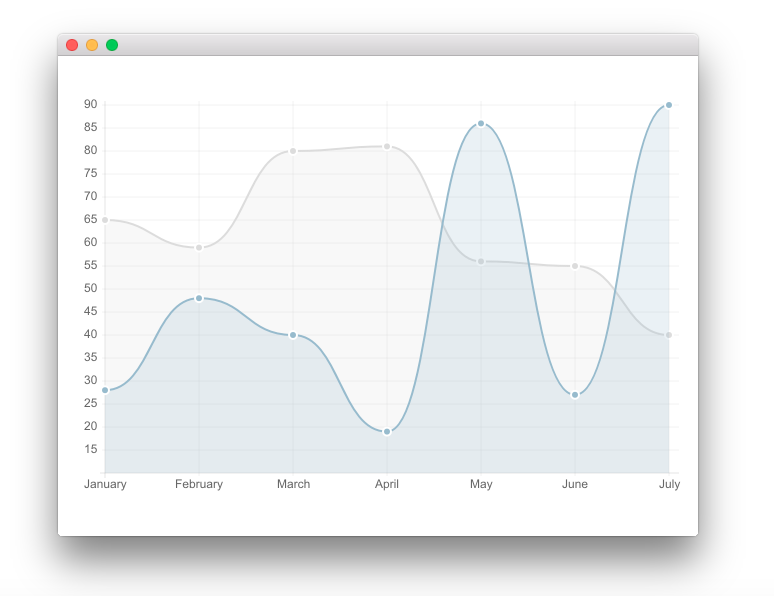
以上です。