はじめに
Webサイトでグラフを表示する必要が出てきたのですが、Rubyではなかなか便利なツールが見つけられなかったので、PyCallを使ってmatplotlibで描画したグラフを表示できないか試してみました。
Pythonの例でも一度ファイルに保存して利用するものが多かったのですが、ここではファイルを経由せずに利用する方法をまとめます。
開発環境
- Ubuntu 16.04.4 LTS
- Ruby 2.3.1p112
- Python 2.7.12
- PyCall 1.0.3
インストール
以下のコマンドで関連ソフトウェアをインストールします。
sudo apt install python-pandas
sudo apt install ruby-dev
sudo gem install pycall�������
sudo gem install pandas
pandasと一緒にmatplotlibがインストールされるので以降の説明では、上記の手順が実行されていることを前提として説明をいたします。
スクリプトの作成
グラフ描画
以下のスクリプトを作成します。
index.cgi
# PyCallの読込
require 'pycall'

# matplotlibの読込および設定
matplotlib = PyCall.import_module('matplotlib')
matplotlib.use('Agg')

# pyplotの読込
plt = PyCall.import_module('matplotlib.pyplot')

# グラフの生成
plt.plot([1,3,2,4])

# グラフの出力
puts "Content-type: image/png\n\n"
plt.savefig(STDOUT, format:'png')
作成したら以下のコマンドで実行権限を与えます。
chmod a+x index.cgi
HTTPサーバ
上記のスクリプトをお試しで動かすため、HTTPサーバもRubyで作ってしまいます。
以下のスクリプトを作成し、index.cgiと同じ場所に保存します。
server.rb
require 'webrick'
module WEBrick
  module HTTPServlet
    FileHandler.add_handler('rb', CGIHandler)
  end
end
server = WEBrick::HTTPServer.new({
  :DocumentRoot => '.',
  :CGIInterpreter => WEBrick::HTTPServlet::CGIHandler::Ruby,
  :Port => '8080',
})
['INT', 'TERM'].each {|signal|
  Signal.trap(signal){ server.shutdown }
}
server.start
動作確認
以下のコマンドでHTTPサーバを起動します。
ruby server.rb
次にブラウザを起動し、localhostにアクセスします。
以下のようなグラフが表示されれば成功!
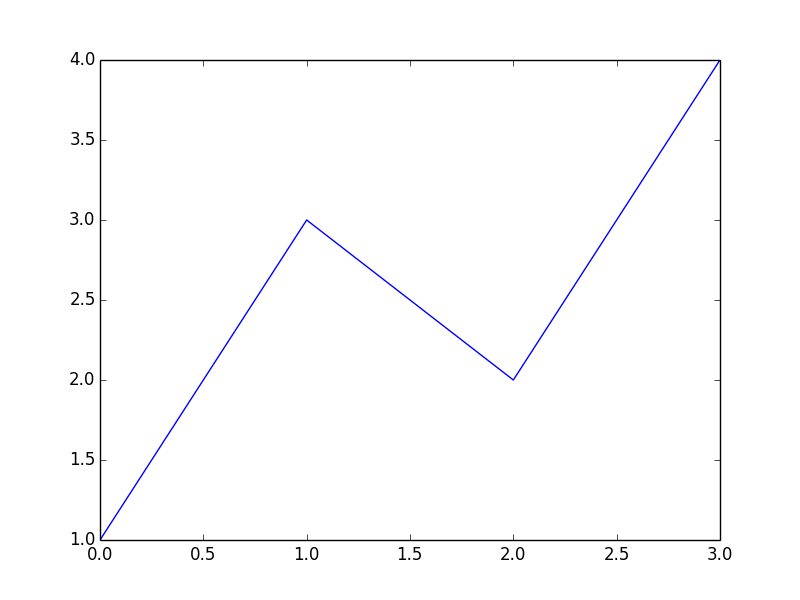
できた!
CSVファイル利用
より実践的に、CSVファイルを読み込んでグラフを描画するサンプルを示します。
csv.rb
# !/usr/bin/env ruby

# PyCallの読込
require 'pycall'
require 'pandas'

# Pandasの読込
pd = Pandas

# matplotlibの読込および設定
matplotlib = PyCall.import_module('matplotlib')
matplotlib.use('Agg')

# pyplotの読込
plt = PyCall.import_module('matplotlib.pyplot')

# CSVファイルの読込
df = pd.read_csv("sample.csv")
df.index = df.pop("x")

# グラフの生成
df.plot()

# グラフの出力
puts "Content-type: image/png\n\n"
plt.savefig(STDOUT, format:'png')
CSVファイルのサンプルを用意します。
 x, y
 1, 3
 3, 5
 4,10
 6, 2
 7, 1
 9, 7
10, 4
同じようにブラウザを起動し、localhostにアクセスします。
以下のようなグラフが表示されれば成功!
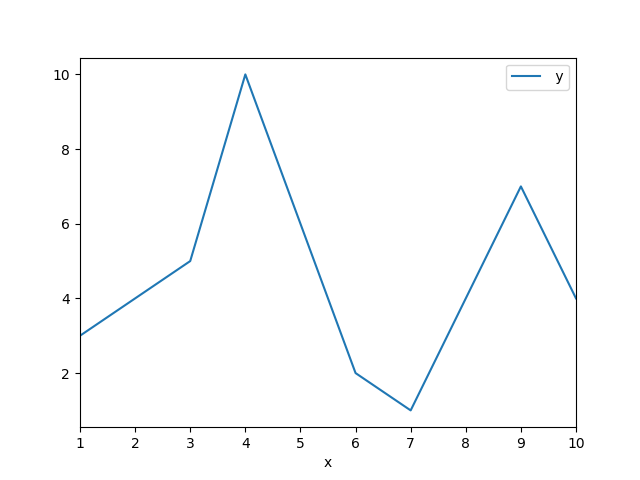
できた!