はじめに
昨日に引き続き、島根県さんの公開されているデータを使って何かできないかと考えていて、河川の水位データが広い範囲にわたって公開されているようなので、これを可視化してみました。
手順確認
公開ページの構成を見る
カタログページ
まず、カタログページがあります。
河川水位ページ
カタログページの中に「河川水位データ」のページがあります。
日別のデータページ
日別で10分おきに保存された河川水位のデータがCSVで保存されているようです。
例えば、6月30日のデータをダウンロードしようと思うと以下のURLにアクセスします。
7月1日は...
あれ?
日別にURLが大きく異なります。
日別のCSV
さらにCSVのURLは...
はい、使いにく〜い!
手順
ということで、以下の手順で可視化作業を行ってみることにします。
- 河川水位データのページから日別ページのURLを取得
- 日別のURLページからCSVのURLを取得
- 取得したCSVのURLからデータを取得
- データの加工
- 可視化
ちなみに、今回もColaboratoryを使用して実行します。
日別ページのURLを取得
以下のスクリプトで日別ページのURLを取得します。
import requests
from bs4 import BeautifulSoup

urlBase = "https://shimane-opendata.jp"
urlName = urlBase + "/db/dataset/010010"

def get_tag_from_html(urlName, tag):
  url = requests.get(urlName)
  soup = BeautifulSoup(url.content, "html.parser")
  return soup.find_all(tag)

def get_page_urls_from_catalogpage(urlName):
  urlNames = []
  elems = get_tag_from_html(urlName, "a")
  for elem in elems:
    try:
      string = elem.get("class")[0]
      if string in "heading":
        href = elem.get("href")
        if href.find("resource") > 0:
          urlNames.append(urlBase + href)
    except:
      pass
  return urlNames

urlNames = get_page_urls_from_catalogpage(urlName)
print(urlNames)
CSVのURLを取得
以下のスクリプトでCSVのURLを取得します。
def get_csv_urls_from_url(urlName):
  urlNames = []
  elems = get_tag_from_html(urlName, "a")
  for elem in elems:
    try:
      href = elem.get("href")
      if href.find(".csv") > 0:
        urlNames.append(href)
    except:
      pass
  return urlNames[0]

urls = []

for urlName in urlNames:
  urls.append(get_csv_urls_from_url(urlName))

print(urls)
URLからデータを取得してデータフレームを作成
上記で取得したURLからデータを直接読み込みます。
ちなみに、文字コードがShift JISになっていることと、最初の5行にデータ以外の情報が入っているのでそれは除きます。
import pandas as pd

df = pd.DataFrame()

for url in urls:
    df = pd.concat([df, pd.read_csv(url, encoding="Shift_JIS").iloc[6:]])

df.shape
データの確認と加工
df.info()
上記を実行すると列の情報が取得できます。
<class 'pandas.core.frame.DataFrame'>
Int64Index: 2016 entries, 6 to 149
Data columns (total 97 columns):
 #   Column   Non-Null Count  Dtype
---  ------   --------------  -----
 0   観測所      2016 non-null   object
 1   岩崎橋      2016 non-null   object
 2   大谷       2016 non-null   object
 3   玉湯川      2016 non-null   object
 4   鹿島       2016 non-null   object
 5   馬橋川      2016 non-null   object
 6   比津川水門上流  2016 non-null   object
 7   比津川水門下流  2016 non-null   object
 8   北田川水門上流  2016 non-null   object
 9   北田川水門下流  2016 non-null   object
 10  京橋川      2016 non-null   object
 11  京橋川水門上流  2016 non-null   object
 12  京橋川水門下流  2016 non-null   object
 13  手貝水門上流   2016 non-null   object
 14  手貝水門下流   2016 non-null   object
 15  神納橋      2016 non-null   object
 16  出雲郷      2016 non-null   object
 17  布部       2016 non-null   object
 18  大渡       2016 non-null   object
 19  矢田       2016 non-null   object
 20  飯梨橋      2016 non-null   object
 21  下山佐      2016 non-null   object
 22  祖父谷川     2016 non-null   object
 23  弘鶴橋      2016 non-null   object
 24  安来大橋     2016 non-null   object
 25  吉田橋      2016 non-null   object
 26  日の出橋     2016 non-null   object
 27  掛合大橋     2016 non-null   object
 28  坂山橋      2016 non-null   object
 29  神田橋1     2016 non-null   object
 30  八口橋      2016 non-null   object
 31  八神       2016 non-null   object
 32  横田新大橋    2016 non-null   object
 33  三成大橋     2016 non-null   object
 34  新橋       2016 non-null   object
 35  高瀬川      2016 non-null   object
 36  五右衛門橋    2016 non-null   object
 37  論田川      2016 non-null   object
 38  湯谷川      2016 non-null   object
 39  西平田      2016 non-null   object
 40  一文橋      2016 non-null   object
 41  仁江       2016 non-null   object
 42  佐田       2016 non-null   object
 43  木村橋      2016 non-null   object
 44  新内藤川     2016 non-null   object
 45  赤川       2016 non-null   object
 46  流下橋      2016 non-null   object
 47  十間川      2016 non-null   object
 48  神西湖      2016 non-null   object
 49  因原       2016 non-null   object
 50  下口羽      2016 non-null   object
 51  川合橋      2016 non-null   object
 52  八日市橋     2016 non-null   object
 53  正原橋      2016 non-null   object
 54  出口       2016 non-null   object
 55  日の出      2016 non-null   object
 56  神田橋2     2016 non-null   object
 57  長久       2016 non-null   object
 58  久手       2016 non-null   object
 59  刺鹿       2016 non-null   object
 60  宅野       2016 non-null   object
 61  善興寺橋     2016 non-null   object
 62  古市橋      2016 non-null   object
 63  江尾       2016 non-null   object
 64  栃谷       2016 non-null   object
 65  近原       2016 non-null   object
 66  日貫       2016 non-null   object
 67  勝地       2016 non-null   object
 68  都治       2016 non-null   object
 69  府中橋      2016 non-null   object
 70  下来原      2016 non-null   object
 71  砂子       2016 non-null   object
 72  三宮橋      2016 non-null   object
 73  中芝橋      2016 non-null   object
 74  浜田大橋     2016 non-null   object
 75  浜田       2016 non-null   object
 76  中場       2016 non-null   object
 77  三隅       2016 non-null   object
 78  西河内      2016 non-null   object
 79  敬川橋      2016 non-null   object
 80  大道橋      2016 non-null   object
 81  昭和橋      2016 non-null   object
 82  染羽       2016 non-null   object
 83  朝倉       2016 non-null   object
 84  喜阿弥川     2016 non-null   object
 85  塔尾橋      2016 non-null   object
 86  相生橋      2016 non-null   object
 87  旭橋       2016 non-null   object
 88  町田       2016 non-null   object
 89  中条       2016 non-null   object
 90  八尾川      2016 non-null   object
 91  八田橋      2016 non-null   object
 92  新堤橋      2016 non-null   object
 93  清見橋      2016 non-null   object
 94  五箇大橋     2016 non-null   object
 95  都万川      2016 non-null   object
 96  美田       2016 non-null   object
dtypes: object(97)
memory usage: 1.5+ MB
みんなDtypeがobjectになっているから、数値データが文字列になっているみたい...
また、少し中を見てみると「未収集」「欠測」「保守」という文字列が入っているようです。
それらの文字情報を取り除いた上で実数値に変換します。
日時のデータも文字列なので、これもシリアル値に変換しないといけないですね。
ということで、以下のスクリプトを実行。
df.index = df["観測所"].map(lambda _: pd.to_datetime(_))

df = df.replace('未収集', '-1')
df = df.replace('欠測', '-1')
df = df.replace('保守', '-1')

cols = df.columns[1:]

for col in cols:
  df[col] = df[col].astype("float")
可視化
日本語表示がおかしくならないよう環境設定をしてからグラフを描画してみます。
!pip install japanize_matplotlib

import matplotlib.pyplot as plt
import japanize_matplotlib
import seaborn as sns

sns.set(font="IPAexGothic")

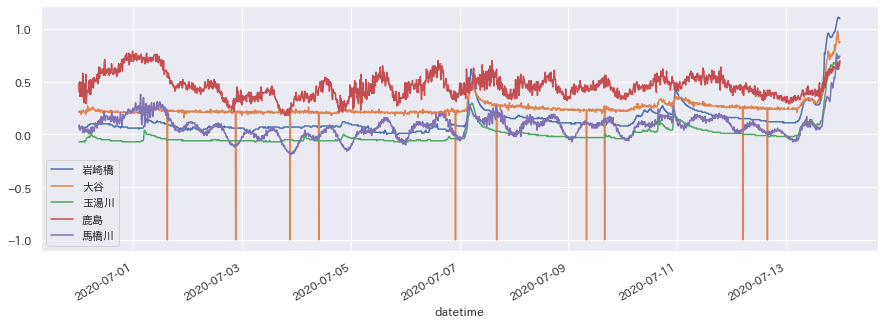
df[cols[:5]].plot(figsize=(15,5))
plt.show()

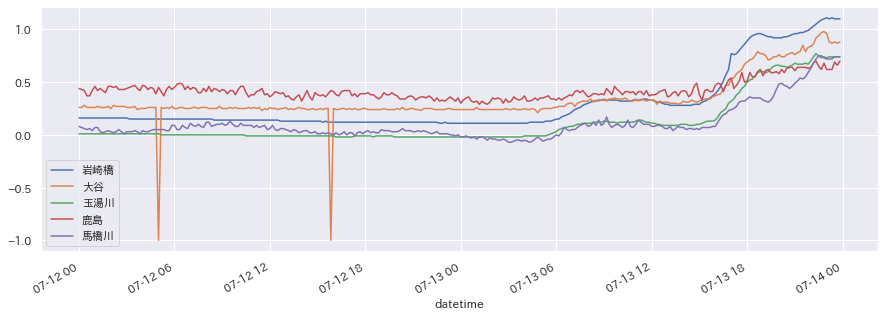
df["2020-07-12":"2020-07-13"][cols[:5]].plot(figsize=(15,5))
plt.show()
先日から雨が続いているので、水位が上がっている様子が一目瞭然ですね。
さて、これから何をするかな〜。

