VSCode のExtension
必要なのはNative Debugだけ
launch.json
デバッグ>構成の追加…でlaunch.jsonを作成する
テンプレートのリンク先の情報があるけど、なかなかズバリの情報が書いていないので
Qemuを使って1234ポートにgdbとつなげる場合のファイルの例
    "version": "0.2.0",
    "configurations": [
        {
            "name": "Attach to QEMU",
            "type": "gdb",
            "request": "attach",
            "executable": "obj/fmp",
            "target": "localhost:1234",
            "remote": true,
            "cwd": "${workspaceRoot}",
            "autorun": [
                "monitor system_reset",
                "load",
                "break main_task"
            ],
            "gdbpath": "/usr/local/gcc-arm-none-eabi-4_8-2014q3/bin/arm-none-eabi-gdb"
executableはプロジェクトからの相対パスで記述する
gdbpathはgdbのファイル名を含めたパスを記載する。パス名を入れないとデバッグ実行時にエラーになります。
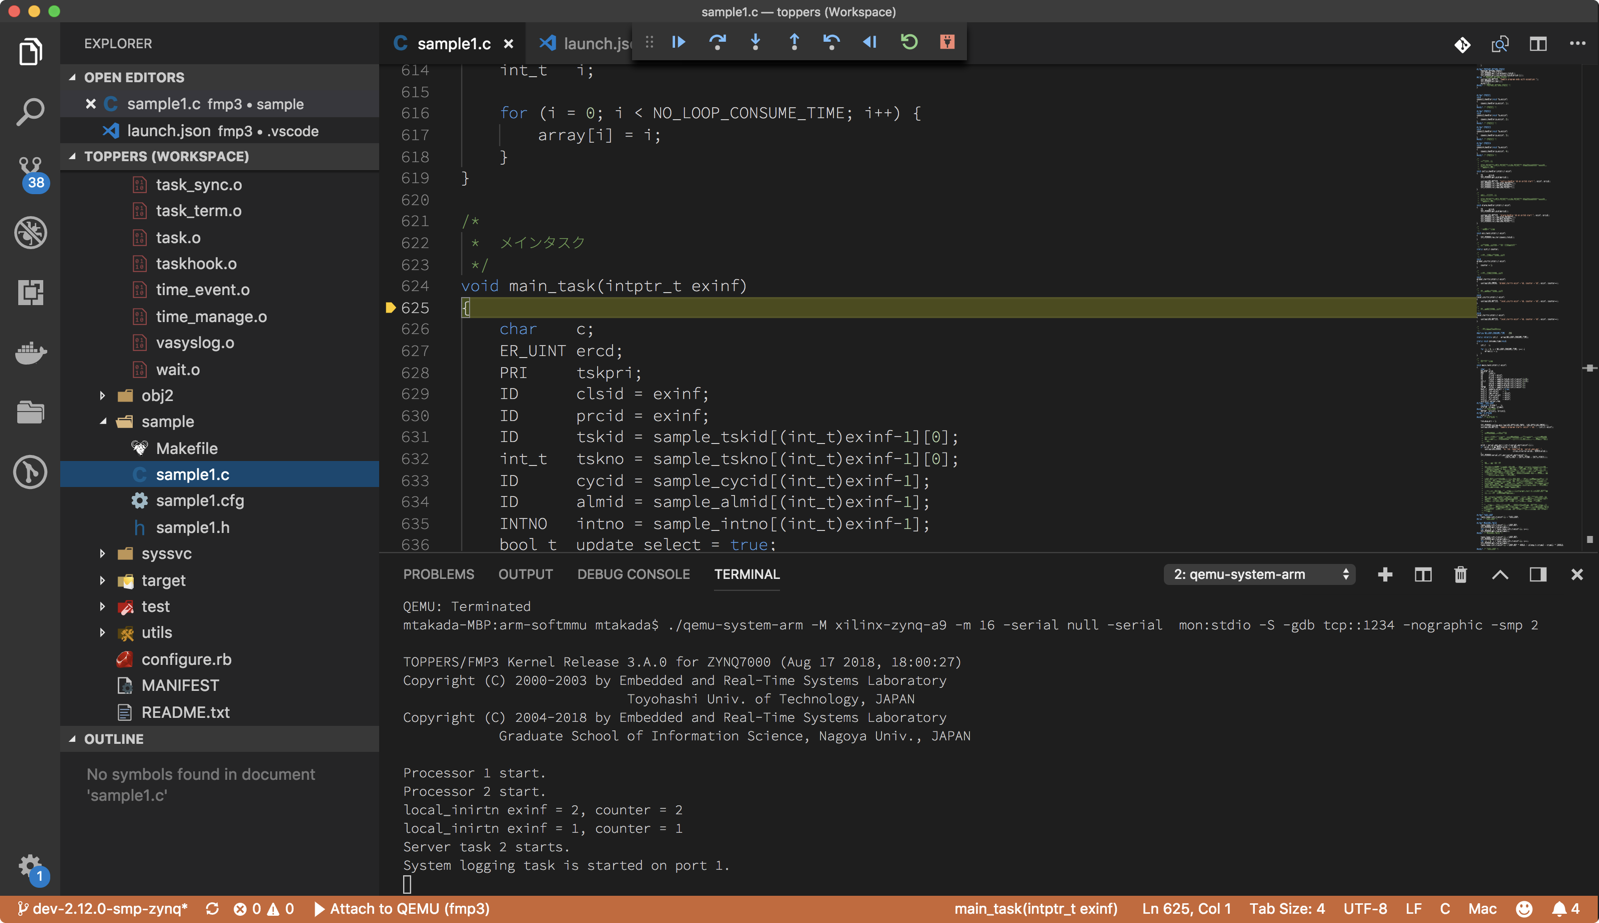
sample1.c にあるmain_taskにブレイクポイントを貼っておくとデバッグ起動時に止まって、そこからVSCodeのUIでgdbでのデバッグ実行が可能になります。