はじめに
Shiny上でleafletによる動的な塗り分け地図(コロプレス図)を表示させる方法を学んだので,そのメモを残しておきます。
コード
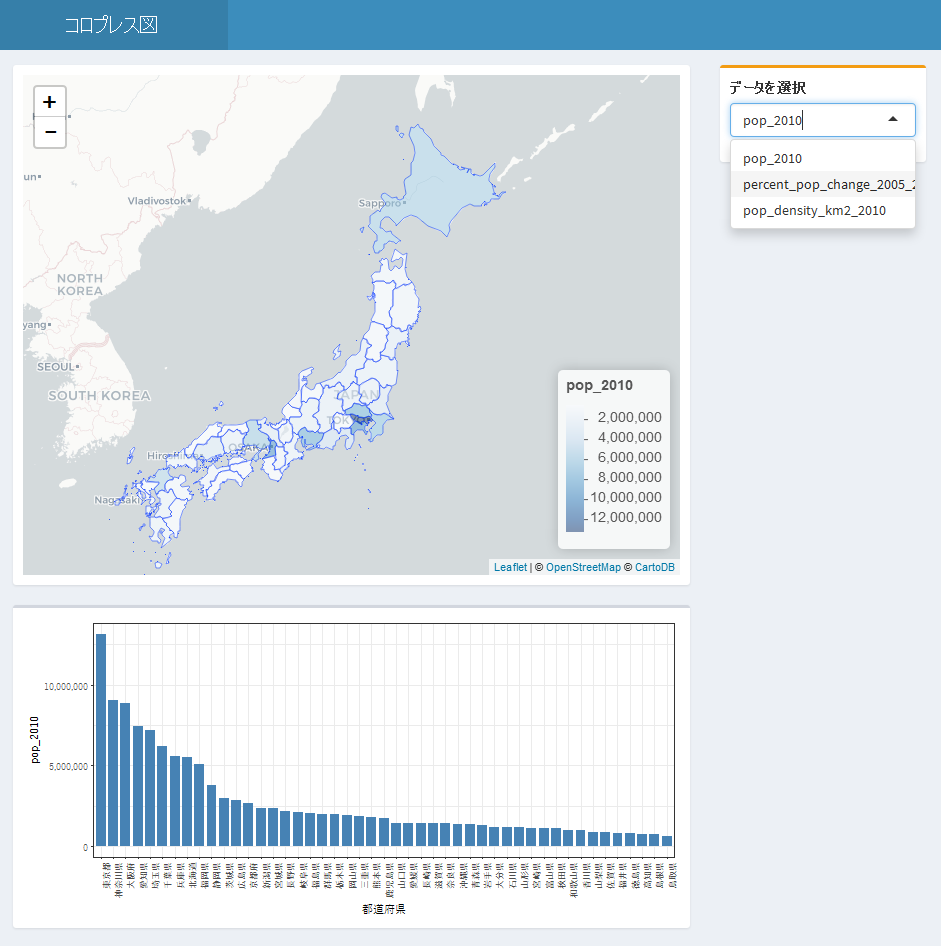
leafletのコロプレス図をメインに表示し,それと同じデータを下部に棒グラフで表示し,図とグラフに表示する変数をプルダウンメニューで切り替えられるようにする,というものです。
global.R}
library(choroplethr)

### データの読み込み ###
data(df_japan_census)
jpn.census <- df_japan_census
jpn.shp <- readRDS("data/JPN_adm1.rds") # Global Administrative Areas http://www.gadm.org/countryより

# 表示用に日本語の都道府県名列を追加
jpn.census <- data.frame(jpn.census, 'prefecture' = jpn.shp@data[["NL_NAME_1"]])

# プルダウン用
col_choice <-  c('pop_2010', 'percent_pop_change_2005_2010',
                 'pop_density_km2_2010')

names(col_choice) <- col_choice
ここでは例として,
統計データは{choroplethr}に付属されているdf_japan_censusというデータセットを,
地図データ(シェープファイル)はGlobal Administrative Areasの日本のデータを使っています。
ui.R}
library(shinydashboard)
library(ggplot2)
library(leaflet)

header <- dashboardHeader(
  title = "コロプレス図"
)


body <- dashboardBody(
  fluidRow(
    column(width = 9,
           box(width = NULL, solidHeader = TRUE,
               leafletOutput("mymap", height = 500) #leaflet
           ),
           box(width = NULL,
               plotOutput("graph", height = 300) #グラフ
           )
    ),
    column(width = 3,
           box(width = NULL, status = "warning",
               selectInput('data', 'データを選択', choices = col_choice, width = 600)
               )
           )
    )
  )

dashboardPage(
  header,
  dashboardSidebar(disable = TRUE),
  body
)
server.R}
library(ggplot2)
library(leaflet)
library(dplyr)
library(shinydashboard)
library(scales)

server <- function(input, output){
  #年齢層の選択
  selectdata <- reactive({
    df <- data.frame('都道府県' = jpn.census$prefecture,
                     'data' = jpn.census[, input$data]  )
  })


  #地図:mymap
  output$mymap <- renderLeaflet({
    pal <- colorNumeric("Blues", domain = jpn.census[, input$data], reverse=F)

    # マウスオーバー時の表示内容を設定(sprintf()で実数表記など指定)
    labels <- sprintf("<strong>%s</strong><br/>%5.1f",
                      paste0(jpn.shp@data$NL_NAME_1),
                      jpn.census[, input$data]) %>% lapply(htmltools::HTML)

    # 地図にプロット
    jpn.shp %>%
      leaflet() %>%
      # setView() : 地図を日本にズームした状態で表示する
      setView(lat=39, lng=139, zoom=5) %>%
      # addProviderTiles() : 背景のタイルを指定
      addProviderTiles(providers$CartoDB.Positron) %>%
      # addPolygons() : 塗り分け地図の描画
      addPolygons(fillOpacity = 0.5,
                  weight=1,
                  fillColor = ~pal(jpn.census[, input$data]),
                  label = labels,
                  labelOptions = labelOptions(
                    style = list("font-weight" = "normal", padding = "3px 8px"),
                    textsize = "15px",
                    direction = "auto"),
                  highlight = highlightOptions(
                    weight = 5,
                    color = "#666",
                    dashArray = "",
                    fillOpacity = 0.7,
                    bringToFront = TRUE)) %>%
      # addLegend() : 凡例の設定
      addLegend("bottomright", pal = pal, values = ~jpn.census[, input$data],
                title = input$data)


      })

  #グラフ:graph
  output$graph <- renderPlot({
    # reorder()によって自動的に順に並べ替える
    g <- ggplot(selectdata(), aes(x = reorder(x = 都道府県, X = -data, FUN = mean),
                                  y = data)) +
      geom_bar(width = 0.8, stat = 'identity', fill='steelblue') +
      theme_bw() +
      ylab(input$data) + xlab('都道府県') +
      scale_y_continuous(labels = scales::comma) + #Y軸を浮動小数点表記しない
      theme(axis.text.x = element_text(angle = 90,hjust = 1)) #X軸目盛りを縦に
    plot(g)
  })

}
完成品がこちらになります。
https://nigimitama.shinyapps.io/leaflet_choropleth_test/
(グラフが表示されるまでの読み込み時間がかなり長いです。このあたりは今後の課題です。)
参考文献
Shiny - Bus dashboard
RStudio Shiny チュートリアル レッスン5 Rスクリプトとデータの利用 - Qiita