はじめに
いくつか似たような事をしている記事も見かけたのですが、私のやりたい事とはちょっとちがったので、自分で作ってみました。
今回使用するのは、Yahoo APIと私の過去の記事でも使っている簡単にWebアプリを作れるPythonのフレームワークstreamlitです。サンプルコードでは、私の行動範囲の名駅、金山、栄、大曽根の現在の降水量を地図上に表示します。
準備
①こちらを参考にYahoo APIを使う準備をして下さい。
②ご自身のPython環境でstreamlitとpydeckを使えるようにしておいて下さい。(※streamlitとpydeckのバージョンによってはエラーが表示されることもあるようです。)
ソースコード
secret.json
{
    "YAHOO_BASE_URL":"https://map.yahooapis.jp/weather/V1/place?",
    "YAHOO_API_KEY":"********************************************************"

}
Observation_point.csv
Point,Lat,Lon
名古屋,35.1710728427982,136.88154762662626
金山,35.143083897127056,136.90118204011583
栄,35.17012937189875,136.9088433977897
大曽根,35.19158480677943,136.93718109779027
Precipitation.py
import json
import pandas as pd
import pydeck as pdk
import requests
import streamlit as st
import time
def get_weather_df():
with open('secret.json') as f:
secret = json.load(f)
BASE_URL = secret["YAHOO_BASE_URL"]
API_KEY = secret["YAHOO_API_KEY"]
base_url = BASE_URL
api_key= API_KEY
parm1 = "coordinates="
parm2 = "&output=json"
parm3 = "&appid="
point_df = pd.read_csv("Observation_point.csv")
weather_df = pd.DataFrame(index=[], columns=["Type", "Date", "Rainfall", "Lon", "Lat", "Point"])
for lat, lon, point in zip(point_df['Lat'], point_df['Lon'], point_df['Point']):
url = base_url + parm1 + str(lon) + "," + str(lat) + parm2 + parm3 + api_key
response = requests.get(url)
# print(response.json())
df = pd.json_normalize(response.json()['Feature'][0]['Property']['WeatherList']['Weather'])
df['Lon'] = lon
df['Lat'] = lat
df['Point'] = point
weather_df = weather_df.append(df, ignore_index=True)
time.sleep(1)
return weather_df
def main():
weather_df = get_weather_df()
# weather_df = pd.read_csv("dummy.csv")
rainfall_df = weather_df[weather_df["Type"] == "observation"].reset_index()
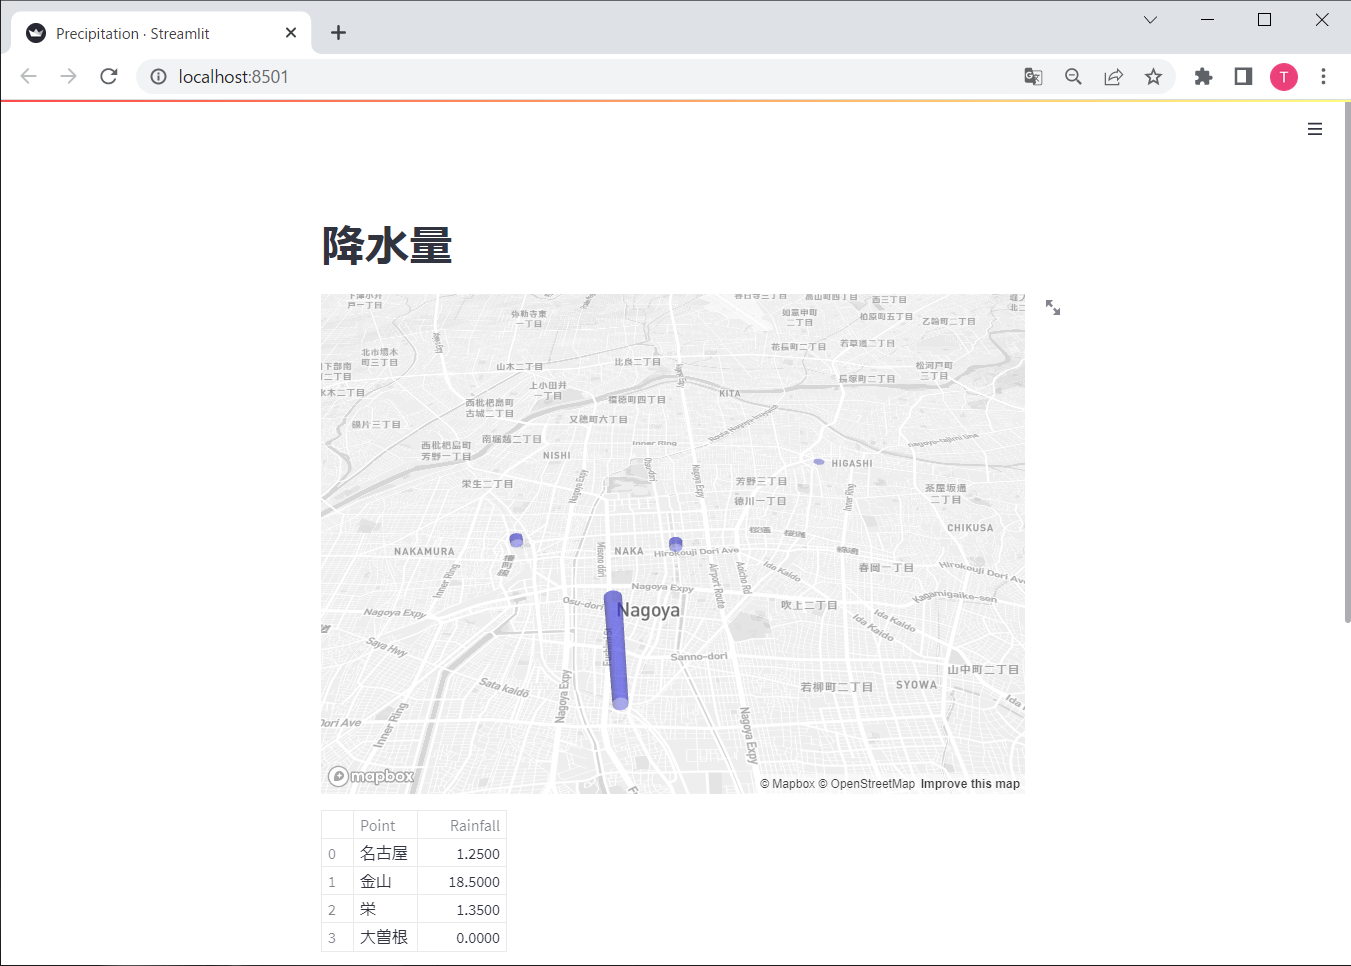
st.title("降水量")
st.pydeck_chart(pdk.Deck(
map_style=None,
initial_view_state=pdk.ViewState(
map_provider="mapbox",
latitude=35.170924,
longitude=136.908367,
zoom=12,
pitch=50,
),
layers=[
pdk.Layer(
"ColumnLayer",
data=rainfall_df,
get_position=["Lon", "Lat"],
get_elevation="Rainfall",
elevation_scale=100,
get_fill_color=[64, 64, 255, 100],
radius=100,
pickable=True,
auto_highlight=True,
)
]
))
st.dataframe(rainfall_df[["Point", "Rainfall"]])
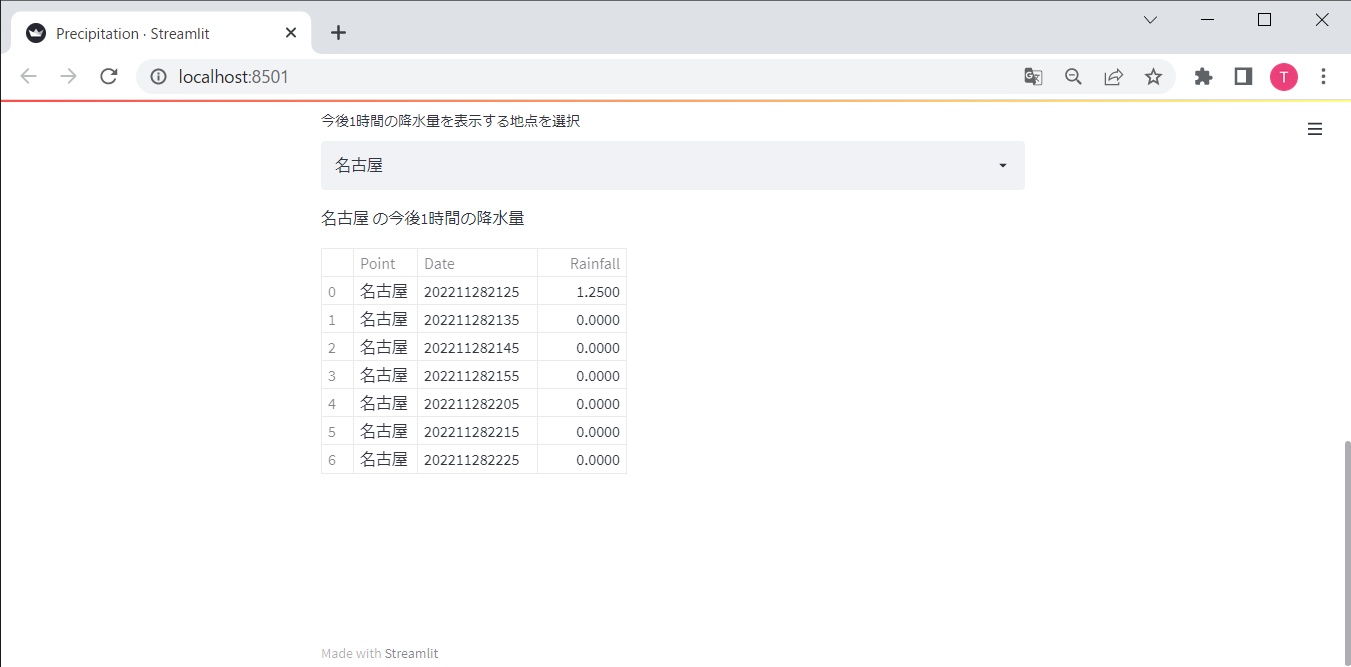
option = st.selectbox('今後1時間の降水量を表示する地点を選択', ('名古屋', '金山', '栄', '大曽根'))
st.write(option, "の今後1時間の降水量")
st.dataframe(weather_df[weather_df["Point"]==option][["Point", "Date", "Rainfall"]])
# クレジットのHTMLソースの掲載
st.write("[Webサービス by Yahoo! JAPAN](https://developer.yahoo.co.jp/sitemap/)")
if __name__ == '__main__':
main()
注:アプリを外部に公開する場合はクレジットのHTMLソースの掲載をして下さい。
ローカル環境での実行
streamlit run --server.address localhost mediapipe_app.py
実行結果
画面①地図上に棒グラフ表示
画面②せっかく今後1時間の降水量も取れるので、選択した地点の今後1時間の降水量をテーブルで表示