前回に引き続き、Udemy【世界で74万人が受講】基礎から理解し、Pythonで実装!機械学習26のアルゴリズムを理論と実践を通じてマスターしようで学んだ内容をアウトプットしていきたいと思います。
(※この記事は勉強した内容のアウトプットを目的としてざっくりと書かれているので、もともと知っていて復習の為に読んだりするにはいいと思いますが、正しく知りたい方は別の記事を読んだほうが良いとおもわれます。コードに関してはライブラリが入っていれば、jupyterなどにコピペすればだいたい動くはずです。)
K平均法
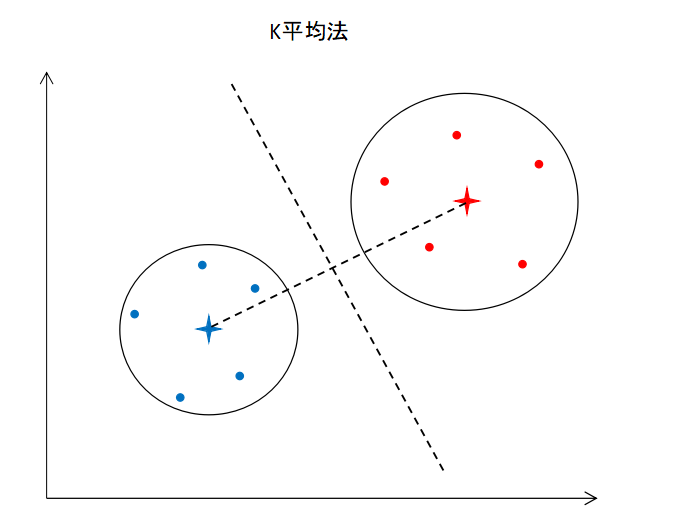
k平均法は次の流れでデータをクラスタリングしていきます。
① クラスターの数(k)を選択する
② セントロイド(重心)をランダムにk個選択する
③ セントロイドからの距離をもとにクラスタリングする
④ クラスターの重心を新たなセントロイドにする
⑤ ③に戻る。クラスタリングした結果が変わらなければ終了
セントロイドの場所によっては適切にクラスタリングできない場合もありますが、k近傍法++を使用する事で対策できます。
クラスターの数を決めるのにはエルボー法やシルエット法が有効。
とりあえず、学んだ内容で今回は、UCバークレー大学の UCI Machine Leaning Repository にて公開されている、「Wholesale customers Data Set (卸売業者の顧客データ)」をk-平均法でクラスタリングしたいと思います。
※ちなみにこのデータの内容にも触れておくと、ポルトガルの卸売業者の顧客のデータで、顧客単位で商品カテゴリ毎の年間支出額が入っています。
ライブラリのインポート
import numpy as np
import matplotlib.pyplot as plt
import pandas as pd
from sklearn.cluster import KMeans
データセットの読み込み
※今回は教師なし学習になるので、独立変数のみで従属変数はありません。
dataset = pd.read_csv('Wholesale customers data.csv')
X = dataset.iloc[:, 2:8]
クラスター数を決めるためのエルボー法を実施
from sklearn.cluster import KMeans

wcss = []

for i in range(1, 10):
  kmeans = KMeans(n_clusters=i, init='k-means++')
  kmeans.fit(X)
  wcss.append(kmeans.inertia_)

plt.plot(range(1, 10), wcss)
plt.xlabel('n_clusters')
plt.ylabel('wcss')
出力したグラフから最適なクラスターの数は3と思われる。
モデルの訓練
kmeans = KMeans(n_clusters=3, init='k-means++')
y_kmeans = kmeans.fit_predict(X)
クラスタリング結果の可視化(※講義には含まれていない)
cluster_data = dataset.copy()
del(cluster_data['Channel'])
del(cluster_data['Region'])
cluster_data['cluster_id'] = y_kmeans

clusterinfo = pd.DataFrame()

for i in range(3):
    clusterinfo['cluster' + str(i)] = cluster_data[cluster_data['cluster_id'] == i].mean()
clusterinfo = clusterinfo.drop('cluster_id')

my_plot = clusterinfo.T.plot(kind='bar', stacked=True)
my_plot.set_xticklabels(my_plot.xaxis.get_majorticklabels(), rotation=0)
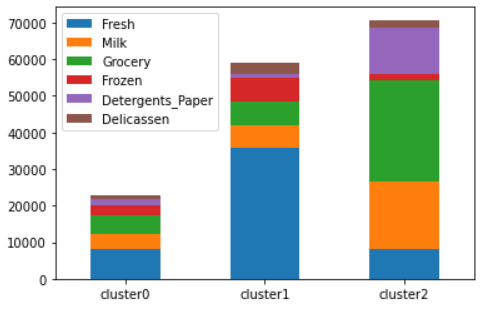
グラフから
・cluster0は Fresh, Mill, Grocery, Frozen, Detergents_Paper をほぼ均等に購買し、全体の購入額が低いグループ
・cluster1は Fresh の購買額が圧倒的に高いグループ
・cluster2は Milk, Grocery, Detergents_Paper の購買額が比較的に高く、全体の購入額も高いグループ
ということがわかります。
階層クラスタリング
階層クラスタリングは以下の流れで行われます。
①全てのデータを一つ一つクラスターにします。(クラスターの数:N個)
②一番距離の近いクラスター2つを1つのクラスターにまとめます。(クラスターの数:N-1個)
②同じように一番距離の近いクラスター2つを1つのクラスターにまとめます。(クラスターの数:N-2個)
②を繰り返して、最終的に1つのクラスターになるまで、クラスターをまとめ続けます。
階層クラスタリングでは樹形図を作成してそこから最適なクラスター数を決定します。
ライブラリのインポート
import numpy as np
import matplotlib.pyplot as plt
import pandas as pd

import scipy.cluster.hierarchy as sch
from sklearn.cluster import AgglomerativeClustering
データセットの読み込み
※今回は教師なし学習になるので、独立変数のみで従属変数はありません。
dataset = pd.read_csv('Wholesale customers data.csv')
X = dataset.iloc[:, 2:8]
樹形図の作成
dendrogram = sch.dendrogram(sch.linkage(X, method='ward'))
plt.title('dendrogram')
plt.xlabel('Customers')
plt.ylabel('Euclidean deistance')
plt.show()
樹形図からここでも3つにクラスタリングされていることがわかります。
モデルの訓練
hc = AgglomerativeClustering(n_clusters=3, linkage='ward')
y_hc = hc.fit_predict(X)
クラスタリング結果の可視化(※講義には含まれていない)
cluster_data = dataset.copy()
del(cluster_data['Channel'])
del(cluster_data['Region'])
cluster_data['cluster_id'] = y_hc

clusterinfo = pd.DataFrame()

for i in range(3):
    clusterinfo['cluster' + str(i)] = cluster_data[cluster_data['cluster_id'] == i].mean()
clusterinfo = clusterinfo.drop('cluster_id')

my_plot = clusterinfo.T.plot(kind='bar', stacked=True)
my_plot.set_xticklabels(my_plot.xaxis.get_majorticklabels(), rotation=0)
グラフから
・cluster0は Fresh の購買額が圧倒的に高いグループ
・cluster1は Milk, Grocery, Detergents_Paper の購買額が比較的に高く、全体の購入額も高いグループ
・cluster2は Fresh, Mill, Grocery, Frozen, Detergents_Paper をほぼ均等に購買し、全体の購入額が低いグループ
ということがわかります。
順番は異なりますが、K平均法と階層クラスタリングで同じようなクラスタリングができました。
今回は簡単に実施したかったため、データから Channel, Region を削除して実施しましたが、one-hotエンコーディングなどでデータを利用すればもっと良いクラスタリングができるかもしれません。
クラスタリングまとめ
| モデル | 長所 | 短所 |
|---|---|---|
| K平均法 | 直感的にわかりやすく、時間もかからない | エルボー法やシルエット法などでクラスター数を求める必要がある |
| 階層クラスタリング | 樹形図によりクラスター数がいくつになるかわかりやすい | クラスタリングに時間がかかる |


