・はじめに
Kerasを使ったディープラーニングを使いこなすにあたって必須知識のメモです。
・次元(ベクトルとテンソル)
スカラー
1つしか含んでいない値のこと
import numpy as np
x = np.array(12)
x
>>> array(12)
x.ndim
>>> 0
ベクトル
所謂、配列のこと
行データ
スカラーの集まり
テンソル
所謂、次元軸のこと
行データ(ベクトル)の集まり
1次配列 = 1次元テンソル
import numpy as np
x = np.array([1, 2, 3])
x
array([1, 2, 3])
x.ndim
>>> 1
2次元配列 = 2次元テンソル
import numpy as np
x = np.array([[1, 2, 3], [1, 2, 3]])
x
array([[1, 2, 3], [1, 2, 3]])
x.ndim
>>> 2
3次元配列 = 3次元テンソル
import numpy as np
x = np.array([
    [
         [1, 2, 3], [1, 2, 3]
    ],
    [
         [1, 2, 3], [1, 2, 3]
    ],
])
x
array([[[1, 2, 3],
        [1, 2, 3]],

       [[1, 2, 3],
        [1, 2, 3]]])
x.ndim
>>> 3
・ベクトルデータ
■ 1次元テンソル
1次元テンソルは1次元配列のデータである。
すなわち配列の要素数 = データセット数である。
■ 2次元テンソル
2次元テンソルのイメージ
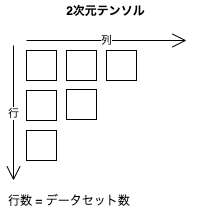
(samples, features)
例:生命表データセット
- ・データ数:10万件
- ・生命表(年齢、国、収入)
- ・テンソル:(100000, 3)
| samples | age | country | annual income |
|---|---|---|---|
| 1 | 25 | jp | 680 |
| 2 | 34 | usa | 1200 |
| 3 | 53 | china | 7000 |
| ... | 42 | usa | 1500 |
| 100000 | 43 | korea | 650 |
■ 3次元テンソル
3次元テンソルのイメージ
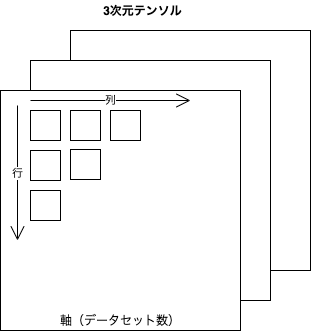
(samples, timesteps, features)
例:株価のデータセット(1分毎の最高値と最安値を360日分用意)
- ・データ数:360件(360日分)
- ・取引時間:390分
- ・データ(1分毎, 最高値、最安値)
- ・テンソル:(360, 3, 390)
timesteps: 390
※取引時間/1分毎
| samples | max | min |
|---|---|---|
| 1 | 20000 | 19900 |
| 2 | 20250 | 19950 |
| 3 | 20170 | 19800 |
| ... | 21330 | 21100 |
| 360 | 23500 | 23300 |
■ 4次元テンソル
(samples, height, width, channels) または(samples, channels, height, width)
※TensorFlowは前者(チャネルラスト)を採用、Theanoは後者(チャネルファースト)を採用。
例:画像のデータセット
- ・データ数:10000件
- ・データサイズ:{"height" : "300px", "width" : "250px"}
- ・チェンネル数:3 ※RGB
- ・テンソル:(10000, 300, 250, 3)
■ 5次元テンソル
(samples, frames, height, width, channels) または(samples, frames, channels, height, width)
例:Youtubeの1分間動画(4FPS、144×256)のビデオクリップのサンプリング
- ・データ数:動画10本
- ・フレーム数:240※60 × 4
- ・チャンネル数:3
-
- ・テンソル:(10, 240, 144, 256, 3)
MNISTの概要
1. (train_images, train_labels), (test_images, test_labels) = mnist.load_data()
・訓練データと訓練用ラベル、テストデータをテスト用ラベルを取得
- 訓練データの中身はこんな感じ※サイズ28×28の画像データが60000件
(60000, 28, 28) - 訓練用ラベルの中身
(2, 1, 3, 9, 7...)
データとラベルは対になっている。
| samples | labels |
|---|---|
| 1 | 2 |
| 2 | 1 |
| 3 | 3 |
| ... | 8 |
| 60000 | 0 |
2. train_images = train_images.reshape(60000, 28 * 28))
・データを2次元テンソル形式に変換
3. train_images = train_images.astype('float32') / 255
・データを8ビット整数値から32ビットfloat型へ変換
4. network = models.Sequential()
ニューラルネットワークモデルを初期化
5. network.add(layers.Dense(512, activation='relu', input_shape=(28 * 28, )))
密結合ネットワークを実装
layers.Dense(出力数, 演算タイプ, 入力数) : 2次元テンソルで活用される密結合モデル
演算タイプ :入力テンソルから出力テンソルへ変換する際の演算タイプを指定
入力数 : テンソル数を指定
6. network.add(layers.Dense(10, activation='softmax'))
密結合ネットワークを実装
※入力数は省略可
7. network.compile(optimizer='rmsprop', loss='categorical_crossentropy', metrics=['accuracy'])
-
optimizer : 最適化関数
入力パラメータ(重み)の値を最適化していく
ニューラルネットワークモデルそのものが最適化されていく -
loss : 損失関数
目的値と予想値から損失率を割り出すための導関数
損失率=0に近づく値を探していく -
metrics : 訓練とテストを監視するための指標
評価基準の定義
8. network.fit(train_images, train_labels, epochs=5, batch_size=128)
128サンプルの小分けされたバッチを用いて訓練データの学習(イテレーション)を5回繰り返す。
※訓練データ全体に渡るイテレーションはエポックと呼ばれる。
イテレーションごとにネットワークはバッチごとの損失値から重みの勾配を計算し、重みを更新していく。
これを5エポック繰り返す。(※各エポックで469回、重みを更新、全体では2345回の値を更新)
[もう少し解説]
- 60000件のデータを128件ごとに損失率をだし、最適化を行う
- 上記1を5回繰り返す