ElasticsearchとKibana、形態素解析エンジンとしてSudachiをインストールしたログです。
以下を参考にしました。
- [Elasticsearch で Sudachi 使う] (https://whitech0c0late.hatenablog.com/entry/2018/05/13/235137)
- Elasticsearchのための新しい形態素解析器 「Sudachi」
- [Install Elasticsearch with RPM]
(https://www.elastic.co/guide/en/elasticsearch/reference/current/rpm.html)
※お試し環境なので可用性・セキュリティは考慮していません。
使用した環境
[インスタンスを作成する - Oracle Cloud Infrastructureを使ってみよう(その3)]
(https://community.oracle.com/docs/DOC-1019204) を参考に、VCN(仮想クラウドネットワーク)を作成し、VM(Computeインスタンス)を作成。
OS:Oracle Linux 7.x (最新のもの) を選択
インスタンス作成後、Public IPアドレスと、Private IPアドレスを確認しておく。
(Compute >> Instances >> Instance Details)
インストール
Javaのインストール。rpmを別途ダウンロードして以下を実行
# mkdir /usr/java
# cd /usr/java/
# rpm -ivh jre-8u191-linux-x64.rpm
/etc/yum.repos.d/elasticsearch.repo を以下の内容で作成
[elasticsearch-6.x]
name=Elasticsearch repository for 6.x packages
baseurl=https://artifacts.elastic.co/packages/6.x/yum
gpgcheck=1
gpgkey=https://artifacts.elastic.co/GPG-KEY-elasticsearch
enabled=1
autorefresh=1
type=rpm-md
Elasticsearch 6.2.0をインストール
(Sudachiプラグインが、最新バージョンのElasticsearchには対応していないようでインストールに失敗したので、Elasticsearchのバージョンを明示的に指定してyum install)
# yum --showduplicates search elasticsearch (※install可能なバージョンを確認)
# yum install elasticsearch-6.2.0-1.noarch
Sudachiプラグインインストール
# yum install maven
# yum install git
# git clone https://github.com/WorksApplications/elasticsearch-sudachi.git
# cd elasticsearch-sudachi/
# mvn package
# /usr/share/elasticsearch/bin/elasticsearch-plugin install file:///root/elasticsearch-sudachi/target/releases/analysis-sudachi-elasticsearch6.2-1.1.0-SNAPSHOT.zip
Kibanaインストール(バージョンを6.2.0に合わせる)
# yum --showduplicates search kibana
# yum install kibana-6.2.0-1.x86_64
起動
以下の確認により、systemctlを使用して起動する
$ ps -p 1
  PID TTY          TIME CMD
    1 ?        00:00:02 systemd
Elasticsearch起動
# /bin/systemctl daemon-reload
# /bin/systemctl enable elasticsearch.service
Created symlink from /etc/systemd/system/multi-user.target.wants/elasticsearch.service to /usr/lib/systemd/system/elasticsearch.service.
# systemctl start elasticsearch.service
Kibana起動
# /bin/systemctl daemon-reload
# /bin/systemctl enable kibana.service
Created symlink from /etc/systemd/system/multi-user.target.wants/kibana.service to /etc/systemd/system/kibana.service.
# systemctl start kibana.service
動作確認
Elasticsearch起動確認
# curl -X GET "localhost:9200/"
{
  "name" : "RTk9yAi",
  "cluster_name" : "elasticsearch",
  "cluster_uuid" : "PtV0gqoQQsGjMa-fBZ1Uhw",
  "version" : {
    "number" : "6.2.0",
    "build_hash" : "37cdac1",
    "build_date" : "2018-02-01T17:31:12.527918Z",
    "build_snapshot" : false,
    "lucene_version" : "7.2.1",
    "minimum_wire_compatibility_version" : "5.6.0",
    "minimum_index_compatibility_version" : "5.0.0"
  },
  "tagline" : "You Know, for Search"
}
Sudachiプラグイン確認
# curl -X GET 'http://localhost:9200/_nodes/plugins?pretty'
{
  "_nodes" : {
    "total" : 1,
..(中略)..
      "plugins" : [        {
          "name" : "analysis-sudachi",
          "version" : "1.1.0-SNAPSHOT",
          "description" : "The Japanese (Sudachi) Analysis plugin integrates Lucene Sudachi analysis module into elasticsearch.",
          "classname" : "com.worksap.nlp.elasticsearch.sudachi.plugin.AnalysisSudachiPlugin",
          "extended_plugins" : [ ],
          "has_native_controller" : false,
          "requires_keystore" : false
        }
      ],
Sudachiの辞書ファイルのダウンロードと配置
# wget https://oss.sonatype.org/content/repositories/snapshots/com/worksap/nlp/sudachi/0.1.1-SNAPSHOT/sudachi-0.1.1-20181108.091011-45-dictionary-core.zip
# mkdir /etc/elasticsearch/sudachi_tokenizer/
# unzip sudachi-0.1.1-20181108.091011-45-dictionary-core.zip
# mv system_core.dic /etc/elasticsearch/sudachi_tokenizer/
sudachi_testという名前のindex作成 (まずは以下の内容でsudachi.json作成)
{
  "settings": {
    "index": {
      "analysis": {
        "tokenizer": {
          "sudachi_tokenizer": {
            "type": "sudachi_tokenizer",
            "mode": "search",
            "discard_punctuation": true
          }
        },
        "analyzer": {
          "sudachi_analyzer": {
            "filter": [
            ],
            "tokenizer": "sudachi_tokenizer",
            "type": "custom"
          }
        }
      }
    }
  }
}
sudachi_testという名前のindex作成
$ curl -X PUT -H "Content-Type: application/json" http://localhost:9200/sudachi_test/ -d @sudachi.json
{"acknowledged":true,"shards_acknowledged":true,"index":"sudachi_test"}
Sudachiの動作を見てみる
「すももももももももものうち」という文字列を入力
Sudachiを使う場合
$ curl -X POST -H "Content-Type: application/json" 'localhost:9200/sudachi_test/_analyze?pretty' -d '{"analyzer": "sudachi_analyzer", "text": "すもももももももものうち"}'
結果
完璧♪
{
  "tokens" : [
    {
      "token" : "すもも",
      "start_offset" : 0,
      "end_offset" : 3,
      "type" : "word",
      "position" : 0
    },
    {
      "token" : "も",
      "start_offset" : 3,
      "end_offset" : 4,
      "type" : "word",
      "position" : 1
    },
    {
      "token" : "もも",
      "start_offset" : 4,
      "end_offset" : 6,
      "type" : "word",
      "position" : 2
    },
    {
      "token" : "も",
      "start_offset" : 6,
      "end_offset" : 7,
      "type" : "word",
      "position" : 3
    },
    {
      "token" : "もも",
      "start_offset" : 7,
      "end_offset" : 9,
      "type" : "word",
      "position" : 4
    },
    {
      "token" : "の",
      "start_offset" : 9,
      "end_offset" : 10,
      "type" : "word",
      "position" : 5
    },
    {
      "token" : "うち",
      "start_offset" : 10,
      "end_offset" : 12,
      "type" : "word",
      "position" : 6
    }
  ]
}
Sudachiを使わない場合(stadardアナライザの利用)
$ curl -X POST -H "Content-Type: application/json" 'localhost:9200/sudachi_test/_analyze?pretty' -d '{"analyzer": "standard", "text": "すもももももももものうち"}'
結果
1文字ずつ分割されている
{
  "tokens" : [
    {
      "token" : "す",
      "start_offset" : 0,
      "end_offset" : 1,
      "type" : "<HIRAGANA>",
      "position" : 0
    },
    {
      "token" : "も",
      "start_offset" : 1,
      "end_offset" : 2,
      "type" : "<HIRAGANA>",
      "position" : 1
    },
    {
      "token" : "も",
      "start_offset" : 2,
      "end_offset" : 3,
      "type" : "<HIRAGANA>",
      "position" : 2
    },
    {
      "token" : "も",
      "start_offset" : 3,
      "end_offset" : 4,
      "type" : "<HIRAGANA>",
      "position" : 3
    },
    {
      "token" : "も",
      "start_offset" : 4,
      "end_offset" : 5,
      "type" : "<HIRAGANA>",
      "position" : 4
    },
    {
      "token" : "も",
      "start_offset" : 5,
      "end_offset" : 6,
      "type" : "<HIRAGANA>",
      "position" : 5
    },
    {
      "token" : "も",
      "start_offset" : 6,
      "end_offset" : 7,
      "type" : "<HIRAGANA>",
      "position" : 6
    },
    {
      "token" : "も",
      "start_offset" : 7,
      "end_offset" : 8,
      "type" : "<HIRAGANA>",
      "position" : 7
    },
    {
      "token" : "も",
      "start_offset" : 8,
      "end_offset" : 9,
      "type" : "<HIRAGANA>",
      "position" : 8
    },
    {
      "token" : "も",
      "start_offset" : 9,
      "end_offset" : 10,
      "type" : "<HIRAGANA>",
      "position" : 9
    },
    {
      "token" : "の",
      "start_offset" : 10,
      "end_offset" : 11,
      "type" : "<HIRAGANA>",
      "position" : 10
    },
    {
      "token" : "う",
      "start_offset" : 11,
      "end_offset" : 12,
      "type" : "<HIRAGANA>",
      "position" : 11
    },
    {
      "token" : "ち",
      "start_offset" : 12,
      "end_offset" : 13,
      "type" : "<HIRAGANA>",
      "position" : 12
    }
  ]
}
リモートからもつながるように設定変更
Elasticsearch(PORT:9200)は、localhostにバインドして起動する設定のため、localhostからしか接続できないようになっていました。
Kibana(PORT:5601)も、最初の設定ではlocalhostからしか接続できないようになっていました。
Elasticsearch, Kibanaの設定ファイル変更し再起動
設定ファイルを変更(必要に応じて元のファイルをcpしてオリジナル版を残しておく)
network.host: 0.0.0.0
server.host: "0.0.0.0"
elasticsearch.url: "http://<PUBLIC_IP_ADDRESS>:9200"
# systemctl restart elasticsearch.service
# systemctl restart kibana.service
このクラウド環境固有の設定変更
ComputeインスタンスのFirewallの設定
デフォルトではSSHサービス以外は全て閉じられているので使用するポートを許可する
# firewall-cmd --list-ports (※現状確認:何も無い)

# firewall-cmd --permanent --add-port=5601/tcp
success
# firewall-cmd --permanent --add-port=9200/tcp
success
# firewall-cmd --reload
success
# firewall-cmd --list-ports
5601/tcp 9200/tcp
Oracle CloudのVCNの設定で、特定PORTへのアクセスを許可
- KibanaへのPORT(5601)を開放
- ElasticsearchのPORT(9200)も一緒に開放
Networking >> Virtual Cloud Networks >> Virtual Cloud Network Details より
「Security Lists」をクリックし、以下の画面に。
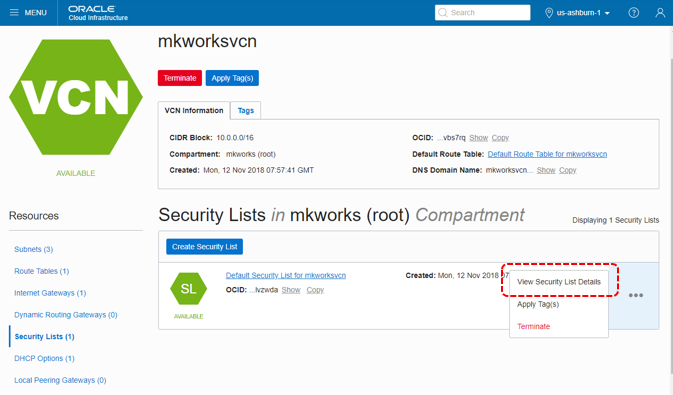
「View Security List Details」をクリック
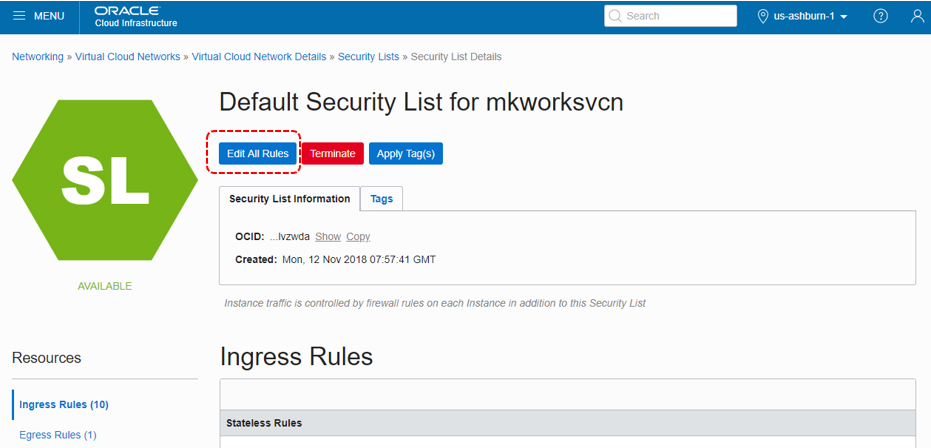
「Edit All Rules」をクリックし、Ingressルールの一番下にある「+ Another Ingress Rules」をクリックし、以下のように全IPアドレス(0.0.0.0)からPORT:5601を追加。
(※アクセスするIPアドレスがわかっている場合は絞って指定)
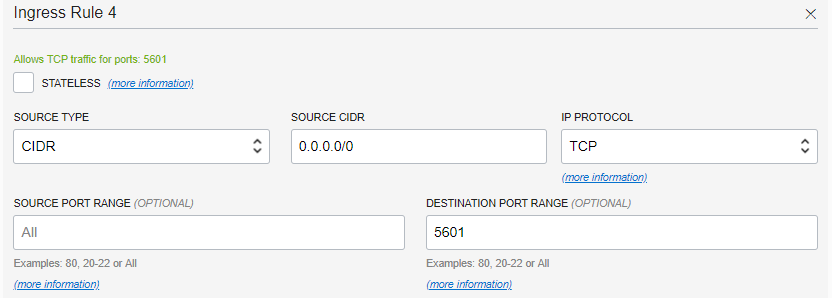
PORT:9200 も同様に追加する。
最後に、一番下にある「Save Security List Rules」を忘れずにクリックし保存。
Kibanaにリモートからアクセス
手元のPCから、http://PUBLIC_IP_ADDRESS:5601/
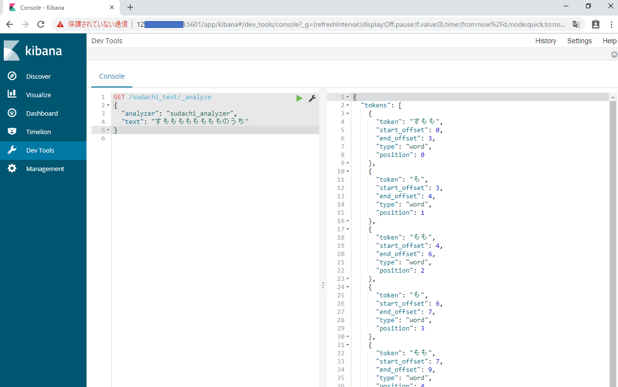
アクセス成功。
Dev Tools → 「すもももももももものうち」を入力してみたところ。
追記
設定の続き。
Elasticsearch + Logstash + Kibana + SudachiプラグインでTwitterを可視化したときのtemplate