Hello again.
Among the data scientists who used python, pandas is the most popular data analysis and manipulation library. It contains various functions and methods to perform data preprocessing and analysis.
Here, I'm trying to cover many functions that we can utilize in many projects.For demonstrations, I will use a famous titanic dataset.
First let's install the pandas
!pip install pandas
1. Import CSV file.
We can import a csv file by using read_csv function. There are many options for advance usage. Please refer the documents for advance usage.
df = pd.read_csv("titanic.csv")
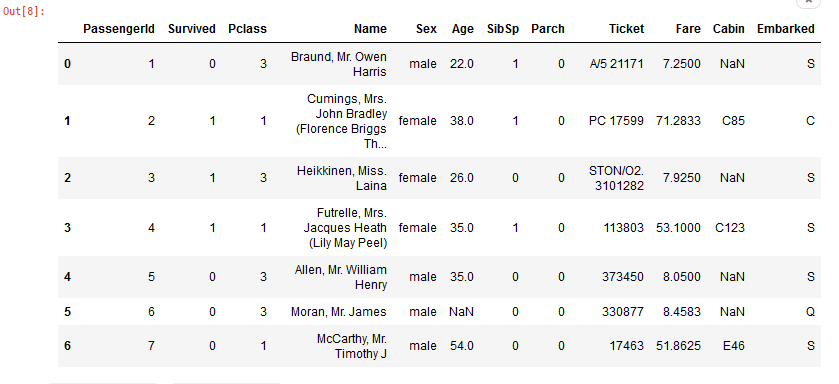
2. View first N rows.
df.head(n=7)
3. View last N rows.
df.tail(n=7)
4. View shape of the DataFrame.
df.shape

# Output >>
(891, 12)
5. Get column names.
df.columns

# Output >>
Index(['PassengerId', 'Survived', 'Pclass', 'Name', 'Sex', 'Age', 'SibSp',
       'Parch', 'Ticket', 'Fare', 'Cabin', 'Embarked'],
      dtype='object')
6. Drop columns.
We can use the drop function to drop the columns or rows. By passing list of column/rows names to drop we can delete those.
df.drop(['Name','SibSp','Pclass'], axis=1, inplace=True)

df.columns
# Output >>
Index(['PassengerId', 'Survived', 'Sex', 'Age', 'Parch', 'Ticket', 'Fare',
       'Cabin', 'Embarked'],
      dtype='object')
Please note that the axis is set to 1 here, which means the function is for columns. If you need to delete rows please use 0.
7. Sampling.
We can get a sample very easily by number of rows or by ratio.
df.shape
# Output >>
(891, 9)

df_sample_1 = df.sample(n=100)
df_sample_1.shape
# Output >>
(100, 9)

df_sample_2 = df.sample(frac=0.75)
df_sample_2.shape
# Output >>
(668, 9)
8. Find missing values.
It is important to deal with the missing values of the data set. Pandas allow us to check the missing values easily by:
df.isna().sum()
# Output >>
PassengerId      0
Survived         0
Sex              0
Age            177
Parch            0
Ticket           0
Fare             0
Cabin          687
Embarked         2
dtype: int64
9. Fill missing values.
Pandas provide a fillna function to fill missing values. It is common to use mean, avg values for this. Note that using method parameters we can fill missing values based on previous or next values. It is useful when we deal with time series data.
For the example : Here there are 177 values missing from the age column. I will use the average age of others to fill the missing values.
avg = df['Age'].mean()
df['Age'].fillna(value=avg, inplace=True)
10. Drop missing values.
For some projects, sometimes we have to delete entire rows which contain missing values. In that case we can use the dropna function.
In this data set there are 2 values missing from the “Embarked” column. We can remove relevant rows by;
print(df.shape)
# Output >>
(891, 9)

df.dropna(subset=['Embarked'], axis=0, how='any', inplace=True)
df.shape
# Output >>
(889, 9)
Please note that the axis is set to 1 here, which means the function is for columns. If you need to delete rows please use 0.
11. Conditional Selections.
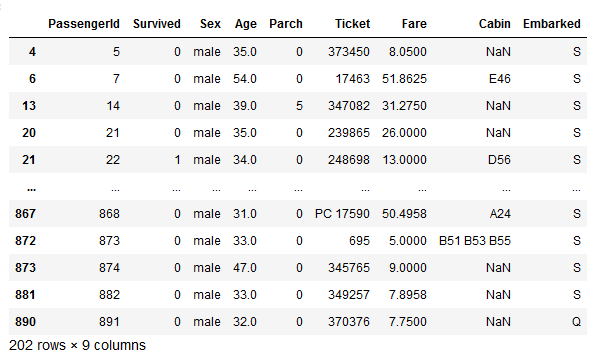
We need to select rows based on certain conditions. In example below codes show selections of passengers whose gender is male. And age is more than 30 years old.
male_30_plus = df[(df.Sex == 'male') & (df.Age> 30)]
male_30_plus
12. Conditional Selections with isin
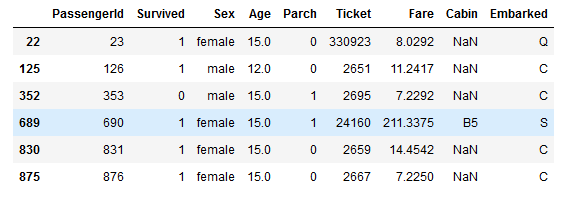
If we need to check several values, we can use isin function, it will return a dataframe which only contains specific values from the column.
Suppose that we need to get passengers ages is 12 and 15,
df[df['Age'].isin([12,15])]
13. Insert new column.
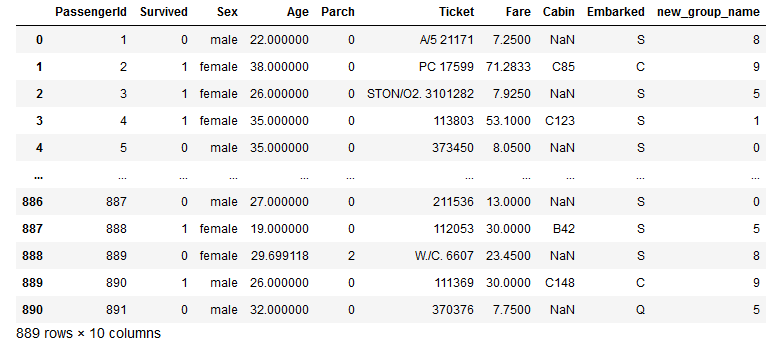
We can easily add a new column to a dataframe like this.
group = np.random.randint(10, size=len(df))
df['new_group_name'] = group
df
If you need to add columns at a specific position , insert function can be used.
df.insert(2, 'new_group_name', group)
14. Ranking
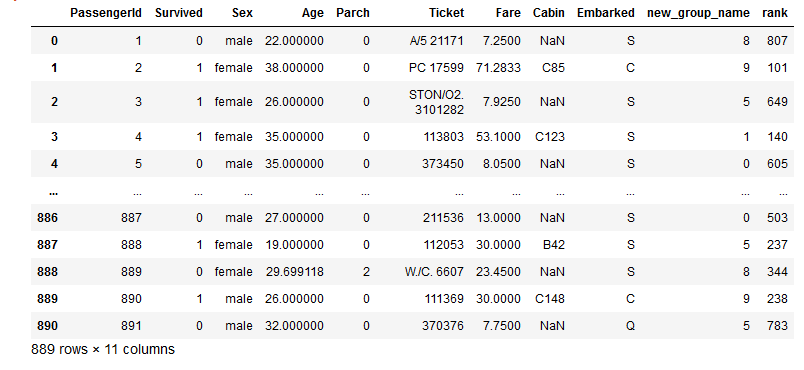
We can rank the values of columns based on their values. Lets rank the passengers according to the ticket price.
df['rank'] = df['Fare'].rank(method='first', ascending=False).astype('int')
df
15. Groupby
This is a mostly used function in pandas. It is easy to get an overview of the data and relationships among the variables.
df.groupby(['Embarked','Sex'])['Survived'].count()
# Output >>
Embarked  Sex
C         female     73
          male       95
Q         female     36
          male       41
S         female    203
          male      441
Name: Survived, dtype: int64
In this example we can get the count of survived people vs, who boarded from 3 ports and gender.
Since this article is becoming long, I will continue from part 2 in later date.
*本記事は @qualitia_cdevの中の一人、@nuwanさんが書いてくれました。
*This article is written by @nuwan a member of @qualitia_cdev.
