sin波の回帰モデルを作成
sin波の回帰モデルは既にQiitaの他の記事にも多く取り上げられていますが、自身が躓いた点も踏まえて記載したいと思います。
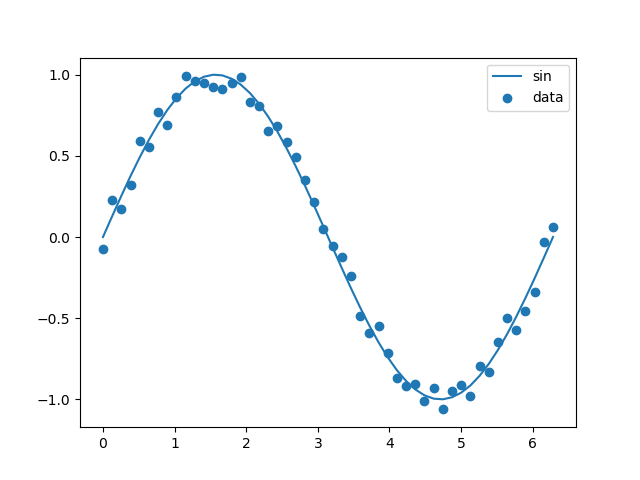
まずはsin波の描画をします。それに付随して学習用データも作成します。
学習用データは誤差を与えてsin波の近似データとします。
sin.py
import numpy as np
import pandas as pd
import matplotlib.pyplot as plt
from sklearn.linear_model import Ridge
from sklearn.model_selection import train_test_split
from sklearn.preprocessing import StandardScaler
from sklearn.pipeline import Pipeline
from sklearn.metrics import r2_score


n = 50

x0 = np.linspace(0, 2 * np.pi, num=n)
# print(x0)
y_org = np.sin(x0)
# print(y_org)
# sin波に誤差を付与する 乱数は0〜1の分布 -> -0.1〜0.1の分布に変換
y0 = np.sin(x0) + (np.random.rand(n)/5 - 0.5/5)
# print(y0)

# 誤差を付与した散布図
plt.scatter(x0, y0, label='data')
# sin波
plt.plot(x0, y_org, label='sin')
# ラベル表示
plt.legend()
# グラフ表示
plt.show()
失敗パターン
このデータをもとにsklearnでsin波の回帰モデルを作成します。
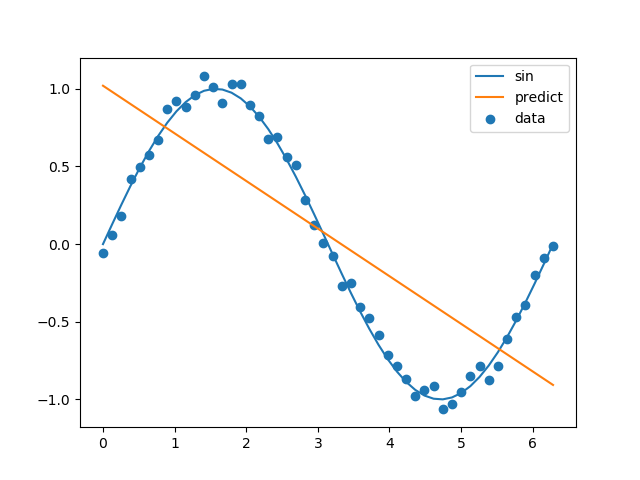
まずは失敗パターンです。
sin.py
import numpy as np
import pandas as pd
import matplotlib.pyplot as plt
from sklearn.linear_model import Ridge
from sklearn.model_selection import train_test_split
from sklearn.preprocessing import StandardScaler
from sklearn.pipeline import Pipeline
from sklearn.metrics import r2_score

n = 50

x0 = np.linspace(0, 2 * np.pi, num=n)
# print(x0)
y_org = np.sin(x0)
# print(y_org)
# sin波に誤差を付与する 乱数は0〜1の分布 -> -0.1〜0.1の分布に変換
y0 = np.sin(x0) + (np.random.rand(n)/5 - 0.5/5)
# print(y0)

# フレーム化
x = pd.DataFrame(x0, columns=['x'])
y = pd.DataFrame(y0, columns=['y'])

# 訓練とテストに分割
X_train,X_test,y_train,y_test = train_test_split(x, y,
                                                 test_size=0.20,
                                                 random_state=1)

# 整形
y_train = y_train.as_matrix().ravel()
y_test = y_test.as_matrix().ravel()

# 標準化、推定器をセット
pipe = Pipeline([('sc', StandardScaler()),
                 ('es', Ridge(alpha=0.1))
                 ])

# 学習
pipe.fit(X_train, y_train)

# 寄与率
print(r2_score(y_test, pipe.predict(X_test)))

# 誤差を付与した散布図
plt.scatter(x0, y0, label='data')
# sin波
plt.plot(x0, y_org, label='sin')
# 回帰
plt.plot(x0, pipe.predict(pd.DataFrame(x0)), label='predict')
# ラベル表示
plt.legend()
# グラフ表示
plt.show()
???ものの見事に失敗しました。
成功パターン
なぜうまくいかないのか、Ridge回帰のパラメータをいじったりしたものの
一向に精度が向上しません(/ω\)
調べていくうちに回帰モデルが線形モデルなのでうまくいかないようでした。
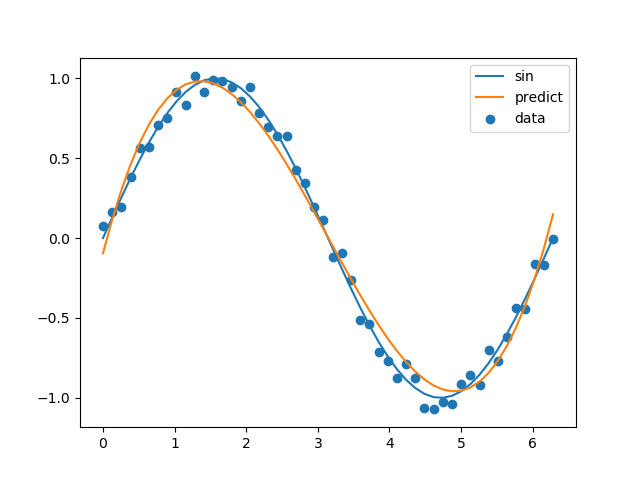
解決案として多項式モデルを導入します。
sin.py
from sklearn.preprocessing import PolynomialFeatures
# 標準化、多項式基底、推定器をセット
pipe = Pipeline([('sc', StandardScaler()),
                 ('pl', PolynomialFeatures(degree=3)),
                 ('es', Ridge(alpha=0.1))
                 ])
PolynomialFeaturesを使うと2次式、3次式といった多項式モデルを作成できるようです。
今回は色々試したところ3次式がマッチしました。
sin.py
import numpy as np
import pandas as pd
import matplotlib.pyplot as plt
from sklearn.linear_model import Ridge
from sklearn.model_selection import train_test_split
from sklearn.preprocessing import StandardScaler
from sklearn.preprocessing import PolynomialFeatures
from sklearn.pipeline import Pipeline
from sklearn.metrics import r2_score

n = 50

x0 = np.linspace(0, 2 * np.pi, num=n)
# print(x0)
y_org = np.sin(x0)
# print(y_org)
# sin波に誤差を付与する 乱数は0〜1の分布 -> -0.1〜0.1の分布に変換
y0 = np.sin(x0) + (np.random.rand(n)/5 - 0.5/5)
# print(y0)

# フレーム化
x = pd.DataFrame(x0, columns=['x'])
y = pd.DataFrame(y0, columns=['y'])

# 訓練とテストに分割
X_train,X_test,y_train,y_test = train_test_split(x, y,
                                                 test_size=0.20,
                                                 random_state=1)

# 整形
y_train = y_train.as_matrix().ravel()
y_test = y_test.as_matrix().ravel()

# 標準化、多項式基底、推定器をセット
pipe = Pipeline([('sc', StandardScaler()),
                 ('pl', PolynomialFeatures(degree=3)),
                 ('es', Ridge(alpha=0.1))
                 ])

# 学習
pipe.fit(X_train, y_train)

# 寄与率
print(r2_score(y_test, pipe.predict(X_test)))

# 誤差を付与した散布図
plt.scatter(x0, y0, label='data')
# sin波
plt.plot(x0, y_org, label='sin')
# 回帰
plt.plot(x0, pipe.predict(pd.DataFrame(x0)), label='predict')
# ラベル表示
plt.legend()
# グラフ表示
plt.show()
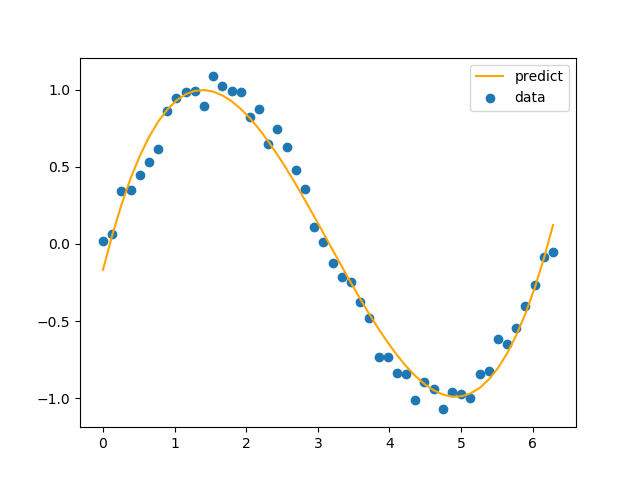
比較のためsin波なし版の画像もアップしておきます。


