初めに
相関図を作成する機会があり簡単に描画できるライブラリはないかと探した所、
vis.js の vis-network が良さそうでした。
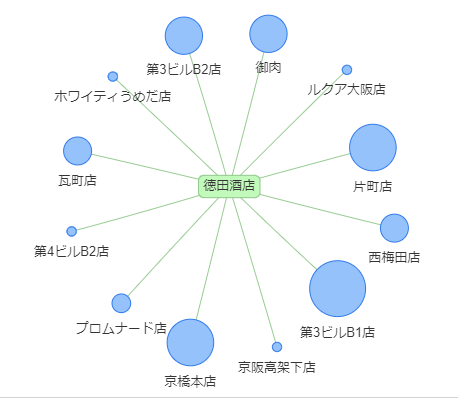
サンプルを参考に自分の好きな飲み屋 徳田酒店 の店舗と利用頻度を描画してみます。
ソースコード
tokuda.html
<!DOCTYPE html>
<html>
<head>
    <meta charset="utf-8">
    <title>test</title>
    <script type="text/javascript" src="https://unpkg.com/vis-network/standalone/umd/vis-network.min.js"></script>
    <style type="text/css">
        #mynetwork {
            width: 600px;
            height: 400px;
            border: 1px solid lightgray;
        }
    </style>
</head>
<body>
<div id="mynetwork"></div>
<script>
    // create an array with nodes
    const nodes = new vis.DataSet([
        {id:1 , label: '徳田酒店', shape: 'box', color:'#C2FABC'},
        {id:'1-1',  label:'京橋本店', size:25},
        {id:'1-2',  label:'片町店', size:25},
        {id:'1-3',  label:'プロムナード店', size:10},
        {id:'1-4',  label:'西梅田店', size:15},
        {id:'1-5',  label:'御肉', size:20},
        {id:'1-6',  label:'第3ビルB1店', size:30},
        {id:'1-7',  label:'第3ビルB2店', size:20},
        {id:'1-8',  label:'第4ビルB2店', size:5},
        {id:'1-9',  label:'瓦町店', size:15},
        {id:'1-10', label:'ルクア大阪店', size:5},
        {id:'1-11', label:'京阪高架下店', size:5},
        {id:'1-12', label:'ホワイティうめだ店', size:5},
    ]);

    // create an array with edges
    var edges = new vis.DataSet([
        {from: 1, to: '1-1' },
        {from: 1, to: '1-2' },
        {from: 1, to: '1-3' },
        {from: 1, to: '1-4' },
        {from: 1, to: '1-5' },
        {from: 1, to: '1-6' },
        {from: 1, to: '1-7' },
        {from: 1, to: '1-8' },
        {from: 1, to: '1-9' },
        {from: 1, to: '1-10' },
        {from: 1, to: '1-11' },
        {from: 1, to: '1-12' },
    ]);

    // create a network
    var container = document.getElementById('mynetwork');

    // provide the data in the vis format
    var data = {
        nodes: nodes,
        edges: edges
    };
    var options = {
        nodes: {
            shape: 'dot',
        }
    };
    // initialize your network!
    var network = new vis.Network(container, data, options);
</script>
</body>
</html>
表示結果
最後に
今回は簡単なものを表現してみましたが大量のノード表示や画像に変更するなども可能です。
どのような表現ができるかは サンプル をご確認下さい。
