はじめに
pythonを使ったデータ分析を用いて、企業のIR情報から成長性・収益性・財務健全性・株主還元姿勢を評価しレポートを作成します。
解決したい課題
データから相関や分布を見て、成長性、収益性、健全性などから優良企業を判断したい。
分析するデータ
企業のIRデータ
主にキャッシュフロー、財務、配当データ

データ取得元:https://irbank.net/download
実行環境
開発環境:Google Coraboratory
言語:Python
ライブラリ:Pandas、Numpy、Matplotlib
分析の流れ
・データの確認
・データの前処理
・業績に影響を与える要素をグラフ化
・業績の予測
実行コード
##データ確認
import pandas as pd

file_path_cf = "/content/drive/MyDrive/SAMURAIプログラミング/CF.xlsx"
file_path_performance = "/content/drive/MyDrive/SAMURAIプログラミング/業績.xlsx"
file_path_finance = "/content/drive/MyDrive/SAMURAIプログラミング/財務.xlsx"
file_path_dividend = "/content/drive/MyDrive/SAMURAIプログラミング/配当.xlsx"

df_cf = pd.read_excel(file_path_cf)
df_performance = pd.read_excel(file_path_performance)
df_finance = pd.read_excel(file_path_finance)
df_dividend = pd.read_excel(file_path_dividend)
データ加工
データをまとめる
4つのファイルに分かれているデータを「年度」を基準に1つのデータに結合
df_marge = df_cf.merge(df_performance, on='年度', how='outer')
df_marge = df_marge.merge(df_finance, on='年度', how='outer')
df_marge = df_marge.merge(df_dividend, on='年度', how='outer')
クリーニング

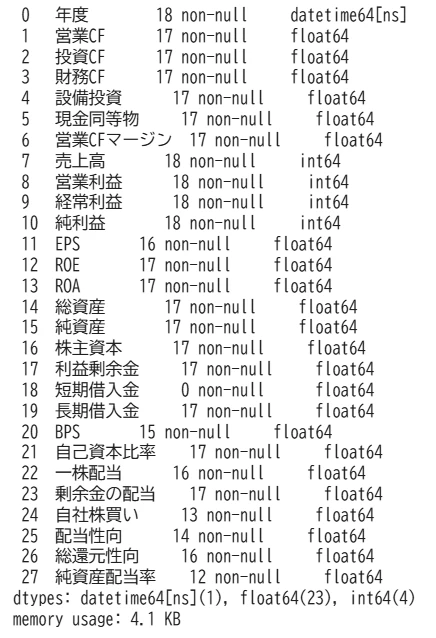
添付の通り、各項目のデータ型がバラバラのため、数値データへ統一する。
cols_to_convert = ['一株配当','自社株買い','剰余金の配当','EPS', 'ROE', 'ROA', 'BPS', '短期借入金', '長期借入金', '自己資本比率', '配当性向', '総還元性向', '純資産配当率']
df_marge[cols_to_convert] = df_marge[cols_to_convert].apply(pd.to_numeric, errors='coerce')
データ計算
売上高、営業利益、経常利益、純利益のそれぞれの成長率を計算
list = ["売上高", "営業利益", "経常利益", "純利益"]
growth_rate = []
for i in list:
  df_marge[f"{i}成長率"] = df_marge[i].pct_change() * 100
可視化したデータ(グラフなど)
#googleコラボラトリでグラフの日本語表記ができるように
!pip install japanize-matplotlib

#matplotlibでのグラフ化
import matplotlib.pyplot as plt
import japanize_matplotlib

plt.figure(figsize=(12, 6))
for col in ["売上高", "営業利益", "経常利益", "純利益"]:
  plt.plot(df_marge["年度"], df_marge[col],marker="o", label=col)

plt.xlabel("年度")
plt.ylabel("金額")
plt.title("売上高、営業利益、経常利益、純利益の推移")
plt.legend()
plt.show()

※2021年はコロナの影響と思う
また上記のコードを参考に他項目も同様にグラフ化してみた


キャッシュフローの相関関係も見てみる。
cf_columns =['営業CF','投資CF','財務CF','現金同等物']
df_cashflow = df_marge[cf_columns]

correlation_matrix = df_cashflow.corr()

plt.figure(figsize=(10, 8))
sns.heatmap(correlation_matrix, annot=True, cmap='coolwarm', fmt=".2f", linewidths=.5)
plt.title('キャッシュフローの相関関係')
plt.show()

投資CFと財務CFの強い負の相関(-0.80) → 「投資資金は外部調達ではなく自己資金で賄う傾向」
営業CFと財務CFのやや負の相関(-0.37) → 「営業CFが良いと、財務CFを抑える(借入を減らす)動き」
営業CFと現金同等物の相関が低い(0.32) → 「キャッシュの増減は営業CF以外の要因も影響」
予測モデル構築
prophetを使用しモデルを構築
from prophet import Prophet
#prophet用にデータを編集
list = ['年度','売上高']
df_prophet = df_marge[list]
df_prophet1 = df_prophet.rename(columns={'年度': 'ds', '売上高': 'y'})

#print(df_prophet1)
model = Prophet()
model.fit(df_prophet1)

future = model.make_future_dataframe(periods=5, freq='Y')
forecast = model.predict(future)
print(forecast)

まずは売上高の先5年を予測してみたが、数字が急上昇している。
課題
企業のIRデータは指標が多いため、他の指標も考慮しないといけない。
まとめ
分析結果として信頼できる分析ができなかった。残念ではあるが、今後は他指標も考慮した分析を進めてみたくなった。調べたところadd_regressorメソッドを使うと回帰項を増やせるらしい。
他にもいろいろ試し、知識を増やしていこうと思う。