はじめに
Mapbox GL JS をよく使っているのですが、色々な参考資料を見ていると、どうやら、API 仕様書等に記載されていないが使える設定等があることに気が付いてきました。この記事にそのような設定をメモしていきたいと思います。
なお、私の調査不足でどこかに書いてある可能性は否めません。また、ソースコードは最新の v2 系を見ていますが、手元の実験は v1 系で行っていますので、ご注意ください。
イベントに style.load 等が使える
Mapbox GL JS のAPIには、style.load というイベントの種類はありません。一方、Mapbox 社のサンプルには、以下のような style.load の使用例があります。
ソースコードだと、ここに書いてあります。
過去の ChangeLog には、以下のような記述も。
実際に試してみます。たとえば、以下のようなイベントを設定してみます。
const map = new mapboxgl.Map({
  container: 'map', // container id
  hash: true, //add #position on URL
  style: 'https://gsi-cyberjapan.github.io/optimal_bvmap/style/std.json', // stylesheet location
  center: [139.7, 35.7], // starting position [lng, lat]
  zoom: 10, // starting zoom
  maxZoom: 17.99,
  localIdeographFontFamily: ['MS Gothic', 'Hiragino Kaku Gothic Pro', 'sans-serif']
});

map.on('load', () => { console.log('A load event occurred.') });
map.on('style', () => { console.log('A style event occurred.') });
map.on('style.load', () => { console.log('A style.load event occurred.') });
map.on('render', () => { console.log('A render event occurred.') });
map.on('idle', () => { console.log('A idle event occurred.') });
map.on('data', () => { console.log('A data event occurred.') });
map.on('styledata', () => { console.log('A styledata event occurred.') });
map.on('dataloading', () => { console.log('A dataloading event occurred.') });
map.on('styledataloading', () => { console.log('A styledataloading event occurred.') });
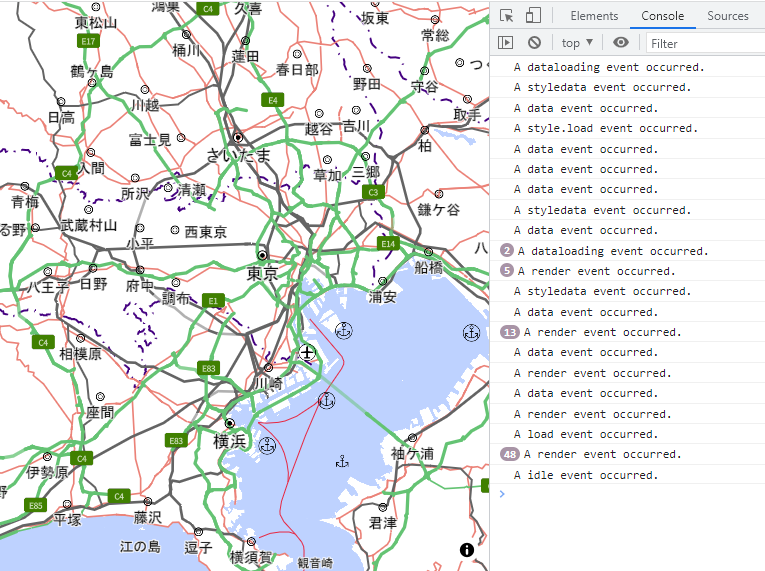
これを実行すると、以下の画像のような順番で実行されました。問題の style.load イベントは、load イベントに比べて比較的早くに起きています。また、load イベント後も、render イベントが続き、最後に idle イベントが起きて落ち着きます。

※Mapbox GL JS v1.13.2 で実験。データ・スタイルは地理院地図Vector 利用。
ほかに、setStyle() でも style.load イベントが起きることを確認しています。ただし、setStyle() のオプションに diff: false を設定する必要があります。デフォルトの diff:true では style.load イベントは起きないようです。
スタイル記述で ref を使うとほかのスタイルレイヤの設定を参照できる
スタイル仕様書には記載されていないのですが、スタイル中で ref を用いて、ほかのスタイルレイヤの ID を指定すると、そのスタイルの設定を参照できるようです。
ソースコードだと、ここに書いてあるようです。
Given an array of layers, some of which may contain
refproperties
whose value is theidof another property, return a new array where
such layers have been augmented with the 'type', 'source', etc. properties
from the parent layer, and therefproperty has been removed.
たぶん、ref で参照する設定は以下の通り(src/style-spec/util/ref_properties.js より)。
type, source, source-layer, minzoom, maxzoom, filter, layout
paint が入っていないので、何重にも paint を書き分ける必要がある設定で有効かもしれません。
以下、使い方のサンプルを書いてみました。
{
  "id": "road-parent",
  "type": "line",
  "source": "vector-tile-1",
  "source-layer": "road",
  "maxzoom": 17,
  "filter": [ "all", [ "==", "rdCtg", 0 ] ],
  "layout": {
    "line-cap": "square",
    "line-join": "round",
    "visibility": "visible"
  },
  "paint": {
    "line-color": "rgba(0,0,255,1)",
    "line-width": 10,
    "line-blur": 3
  }
},
{
  "id": "road-child-01",
  "ref": "road-parent",
  "paint": {
    "line-color": "rgba(255,0,0,1)",
    "line-width": 4
  }
},
{
  "id": "road-child-02",
  "ref": "road-parent",
  "paint": {
    "line-color": "rgba(255,255,255,1)",
    "line-width": 2
  }
}

※Mapbox GL JS v1.13.2 で実験。データは地理院地図Vector 利用。
地物の図形タイプにかかわらずに、スタイルレイヤ type を設定する
スタイル仕様書では、スタイルレイヤの type 毎に、適用できる図形タイプ(点、線、面)が決められています。
- line
You can use a line layer to configure the visual appearance of polyline or multipolyline features.
- fill
You can use a fill layer to configure the visual appearance of polygon or multipolygon features.
- circle
You can use a circle layer to configure the visual appearance of point or point collection features in vector tiles.
一方、これらを無視して、ラインデータやポリゴンデータにこれらのスタイルを設定すると、無理やりなのかはわかりませんが、表示をしてくれます。ポリゴンデータに line のスタイルレイヤを適用することは、結構頻繁にありそうです。
-
circle スタイルレイヤ
-
line スタイルレイヤ
-
fill スタイルレイヤ
ほかに、fill-extrusion レイヤに ラインデータを渡すと、描画がおかしくなることを確認したことがあります。文字の描画(symbol/icon レイヤ)は、また別の挙動がありそうです。
これらがどのように描画されているかは、以下の記事を参考にソースコードをたどってみましたが、シェーダーまで確認する必要がありそうなので、断念しました。
最後に
また何か見つけたら追記します。


