これは何
Spark を使用してサンプルクラスターを起動し、Amazon S3 バケットに格納する単純な PySpark スクリプトを実行していきます。
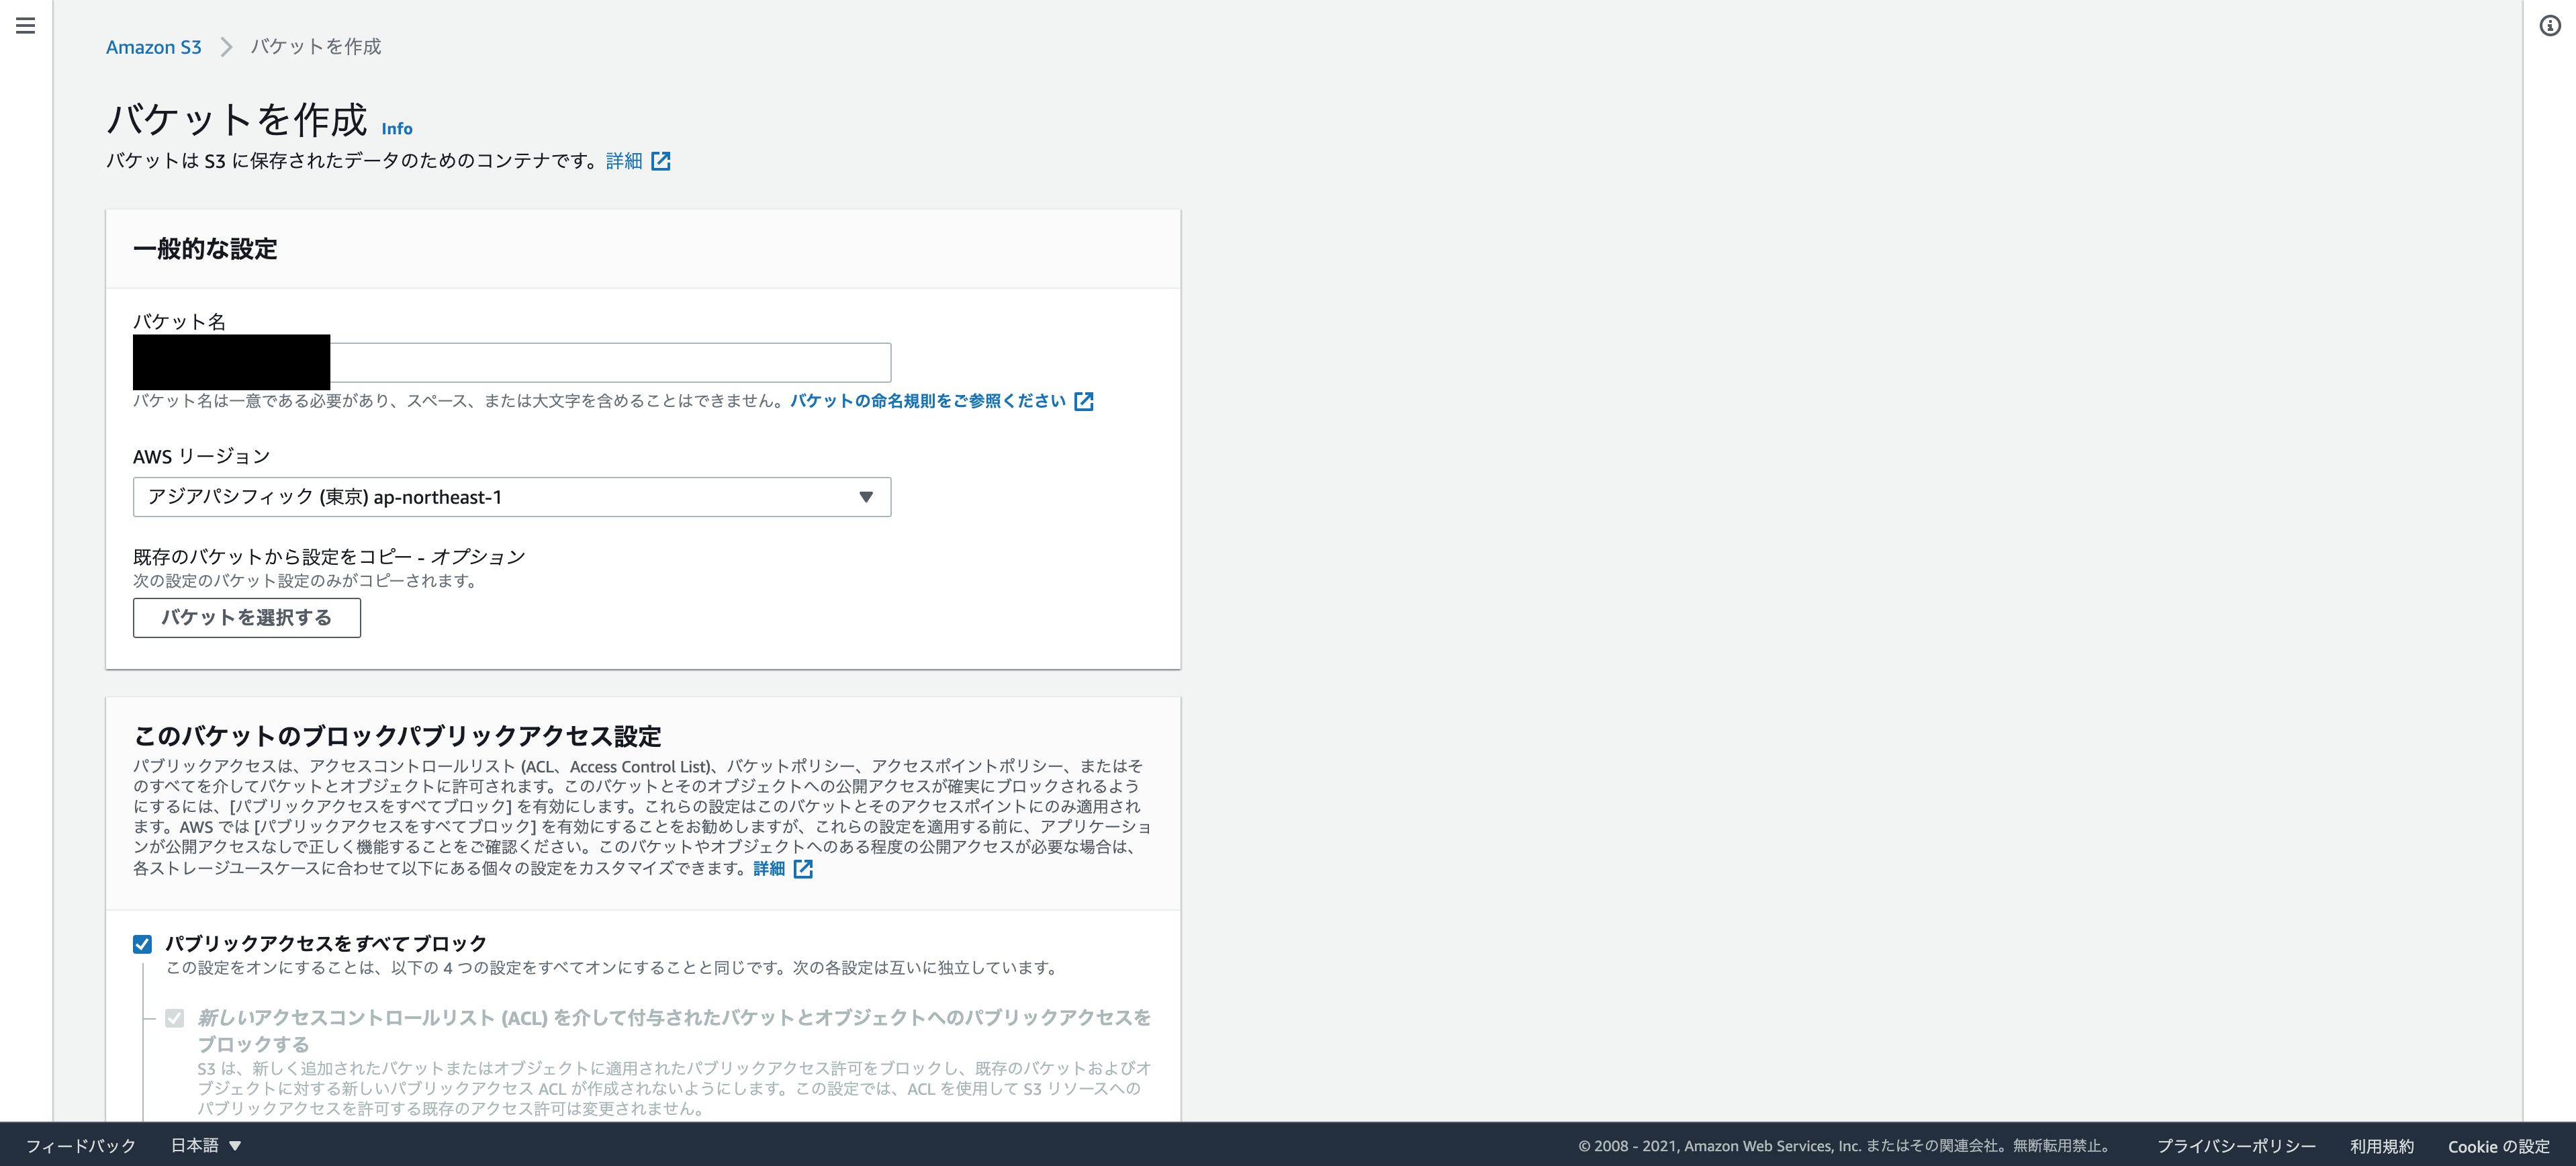
S3作成
適当にS3を作成します。
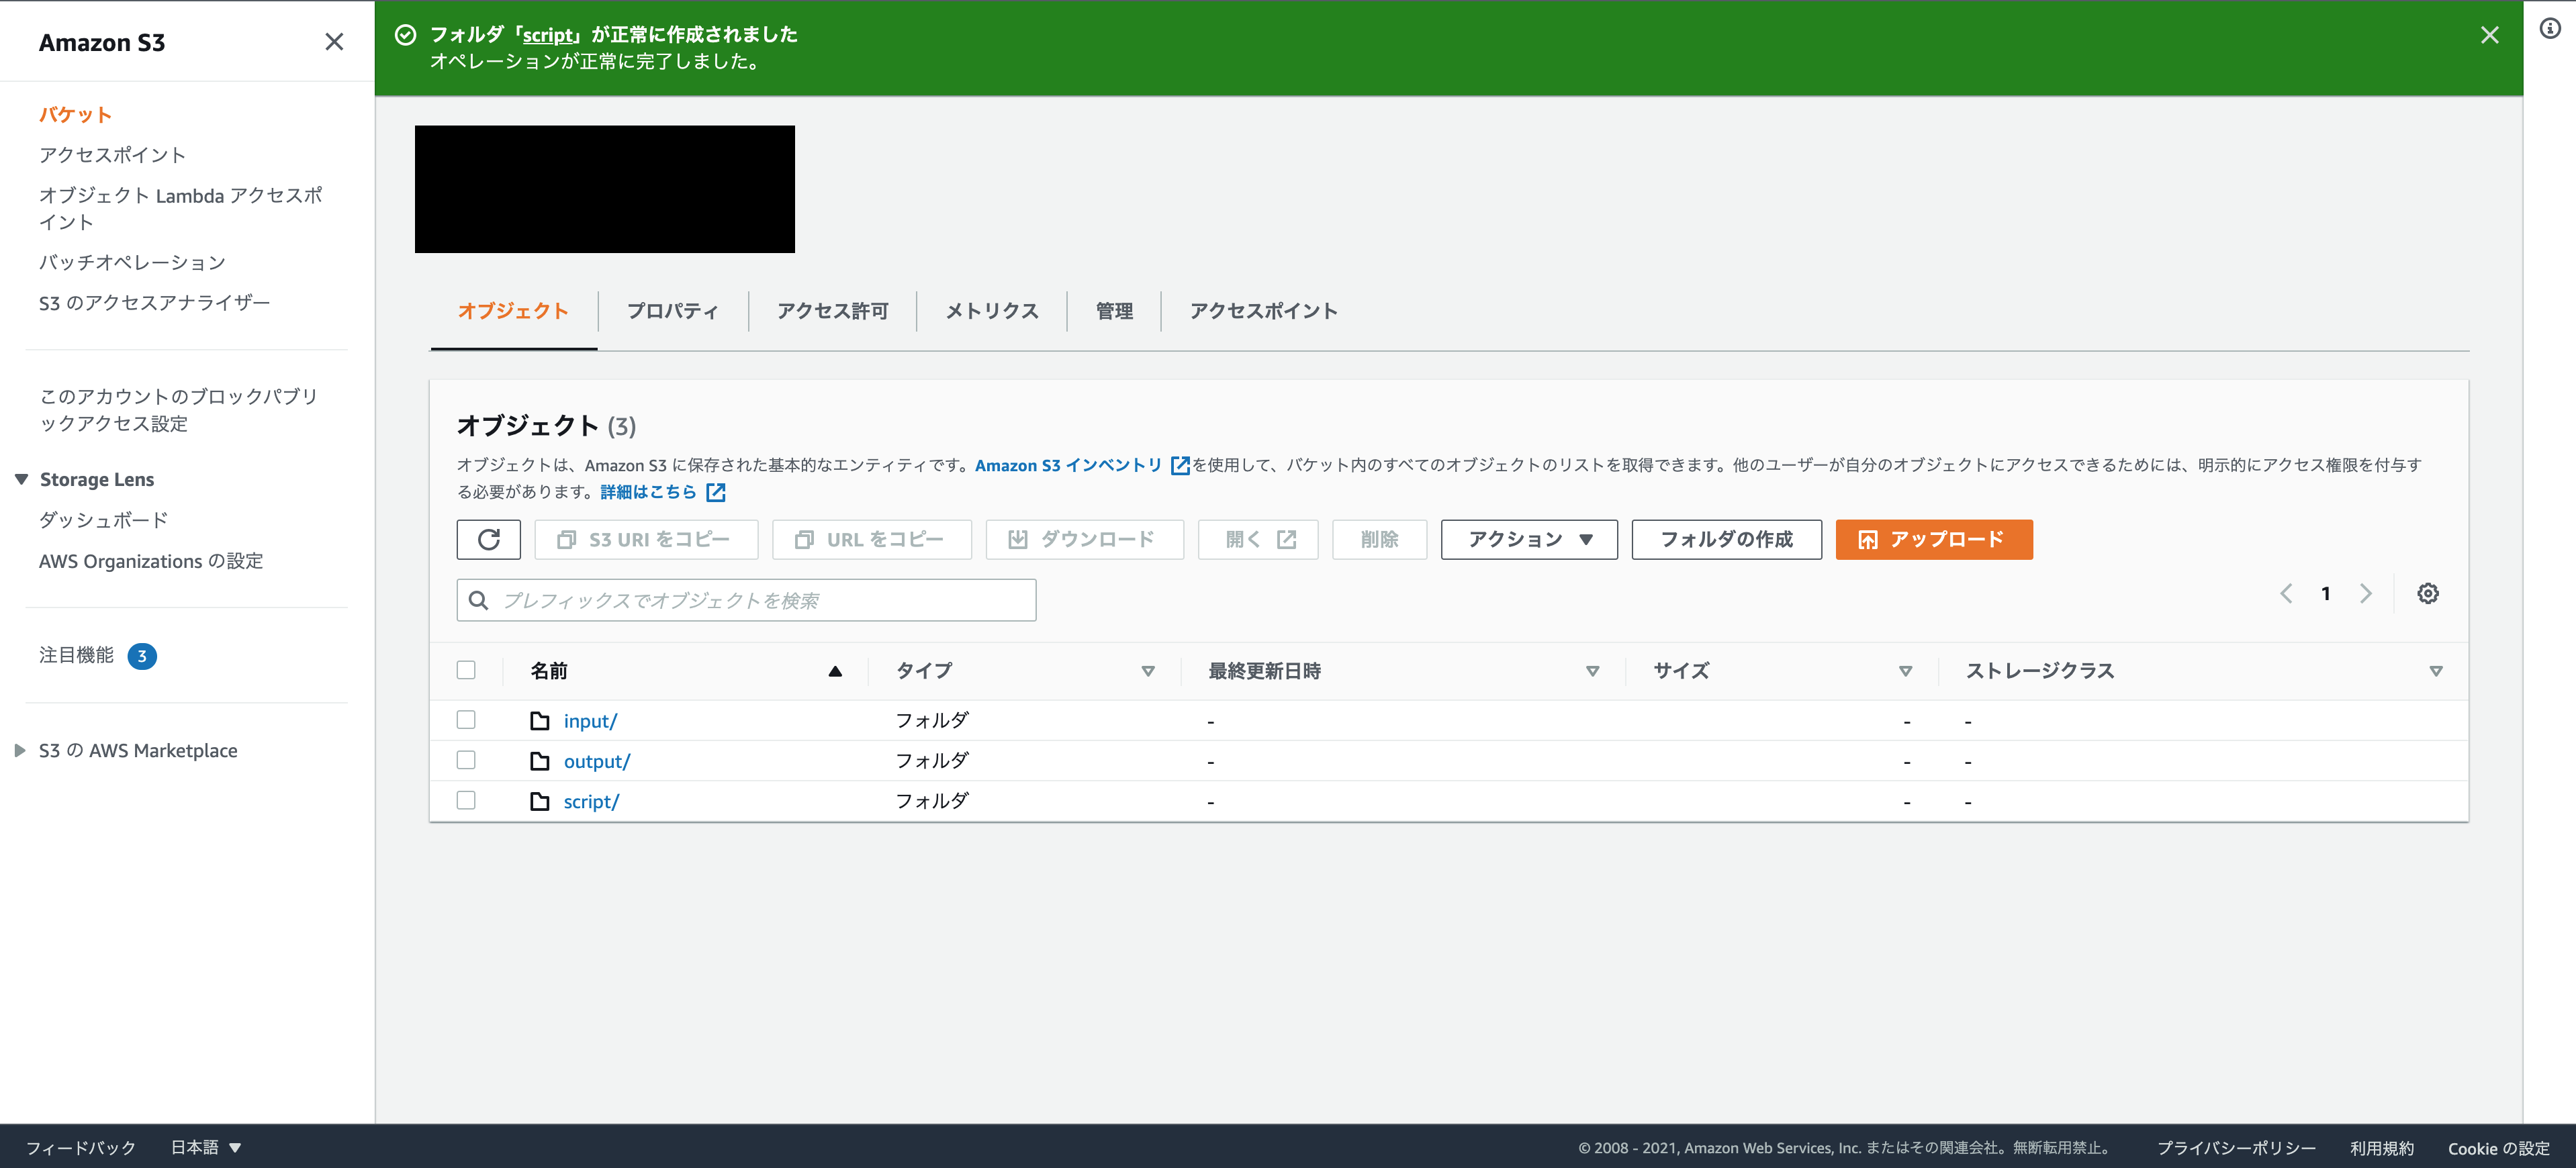
フォルダを作成する
以下のフォルダを作成します。
output:ログと進行中のアウトプットを入れます。
script:PySparkスクリプト、csvファイルを入れます。
先ほど作成したオブジェクトへ行き、上記フォルダを作成します。
scriptファイルを置く
import argparse

from pyspark.sql import SparkSession

def calculate_red_violations(data_source, output_uri):
    """
    Processes sample food establishment inspection data and queries the data to find the top 10 establishments
    with the most Red violations from 2006 to 2020.

    :param data_source: The URI where the food establishment data CSV is saved, typically
			  an Amazon S3 bucket, such as 's3://DOC-EXAMPLE-BUCKET/food-establishment-data.csv'.
    :param output_uri: The URI where the output is written, typically an Amazon S3
                       bucket, such as 's3://DOC-EXAMPLE-BUCKET/restaurant_violation_results'.
    """
    with SparkSession.builder.appName("Calculate Red Health Violations").getOrCreate() as spark:
        # Load the restaurant violation CSV data
        if data_source is not None:
            restaurants_df = spark.read.option("header", "true").csv(data_source)

        # Create an in-memory DataFrame to query
        restaurants_df.createOrReplaceTempView("restaurant_violations")

        # Create a DataFrame of the top 10 restaurants with the most Red violations
        top_red_violation_restaurants = spark.sql("SELECT name, count(*) AS total_red_violations " +
          "FROM restaurant_violations " +
          "WHERE violation_type = 'RED' " +
          "GROUP BY name " +
          "ORDER BY total_red_violations DESC LIMIT 10 ")

        # Write the results to the specified output URI
        top_red_violation_restaurants.write.option("header", "true").mode("overwrite").csv(output_uri)

if __name__ == "__main__":
    parser = argparse.ArgumentParser()
    parser.add_argument(
        '--data_source', help="The URI where the CSV restaurant data is saved, typically an S3 bucket.")
    parser.add_argument(
        '--output_uri', help="The URI where output is saved, typically an S3 bucket.")
    args = parser.parse_args()

    calculate_red_violations(args.data_source, args.output_uri)
このpyファイルを、S3コンソールで、scriptフォルダにアップロードします。
また、food_establishment_data.zipファイルをダウンロードします。
コンテンツを解凍し、food_establishment_data.csv としてローカルに保存します。
これも同様に、scriptフォルダにアップロードします。
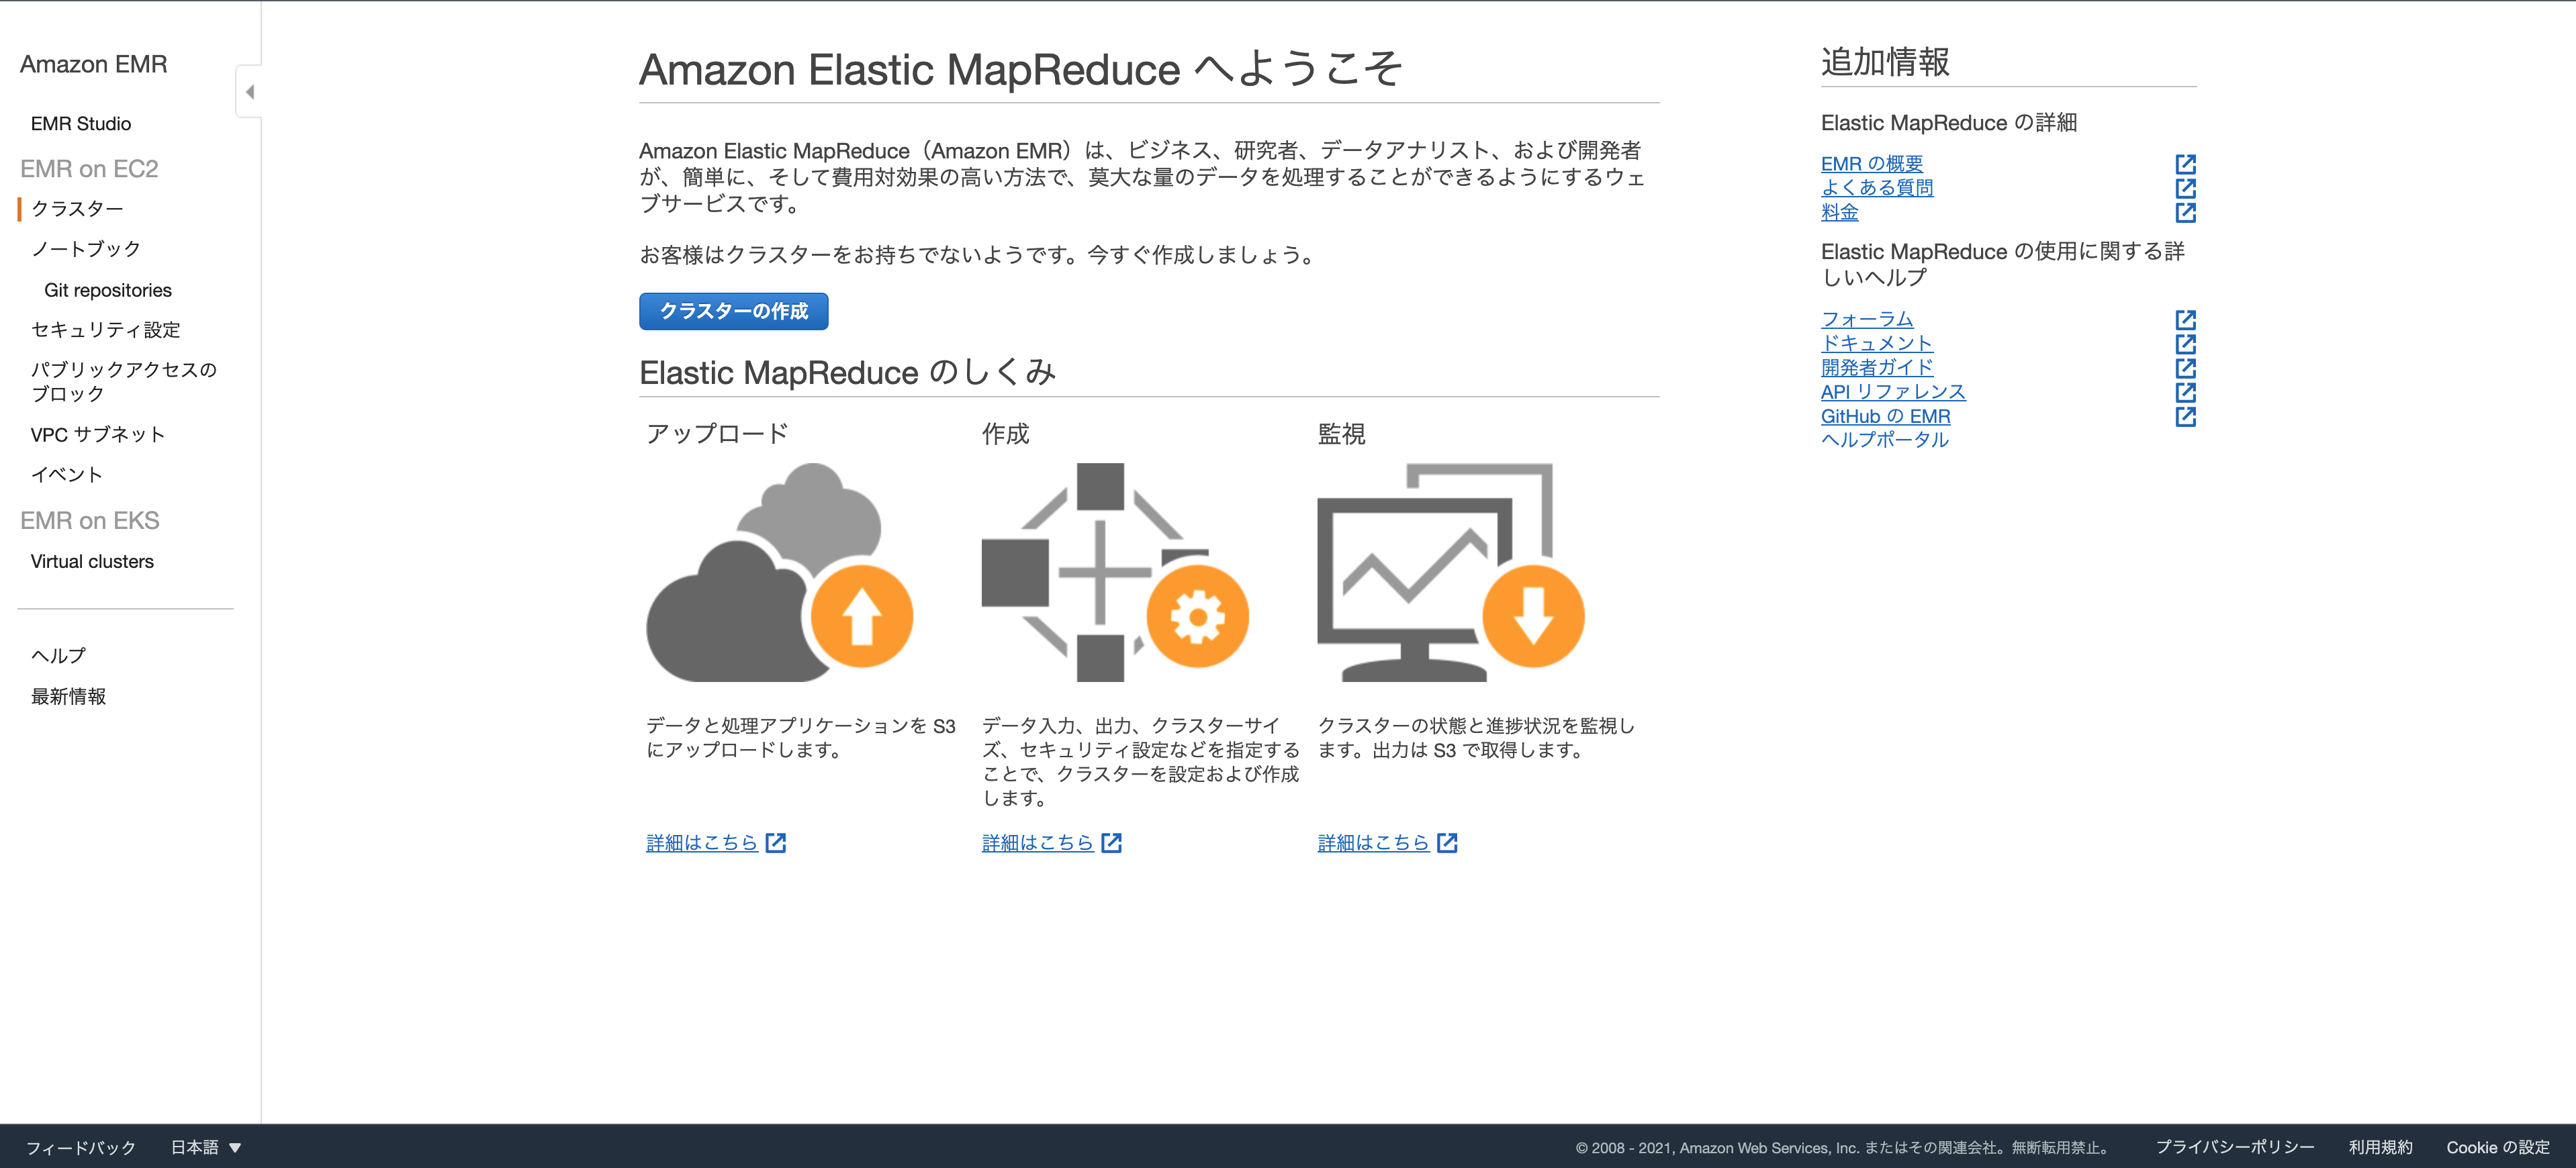
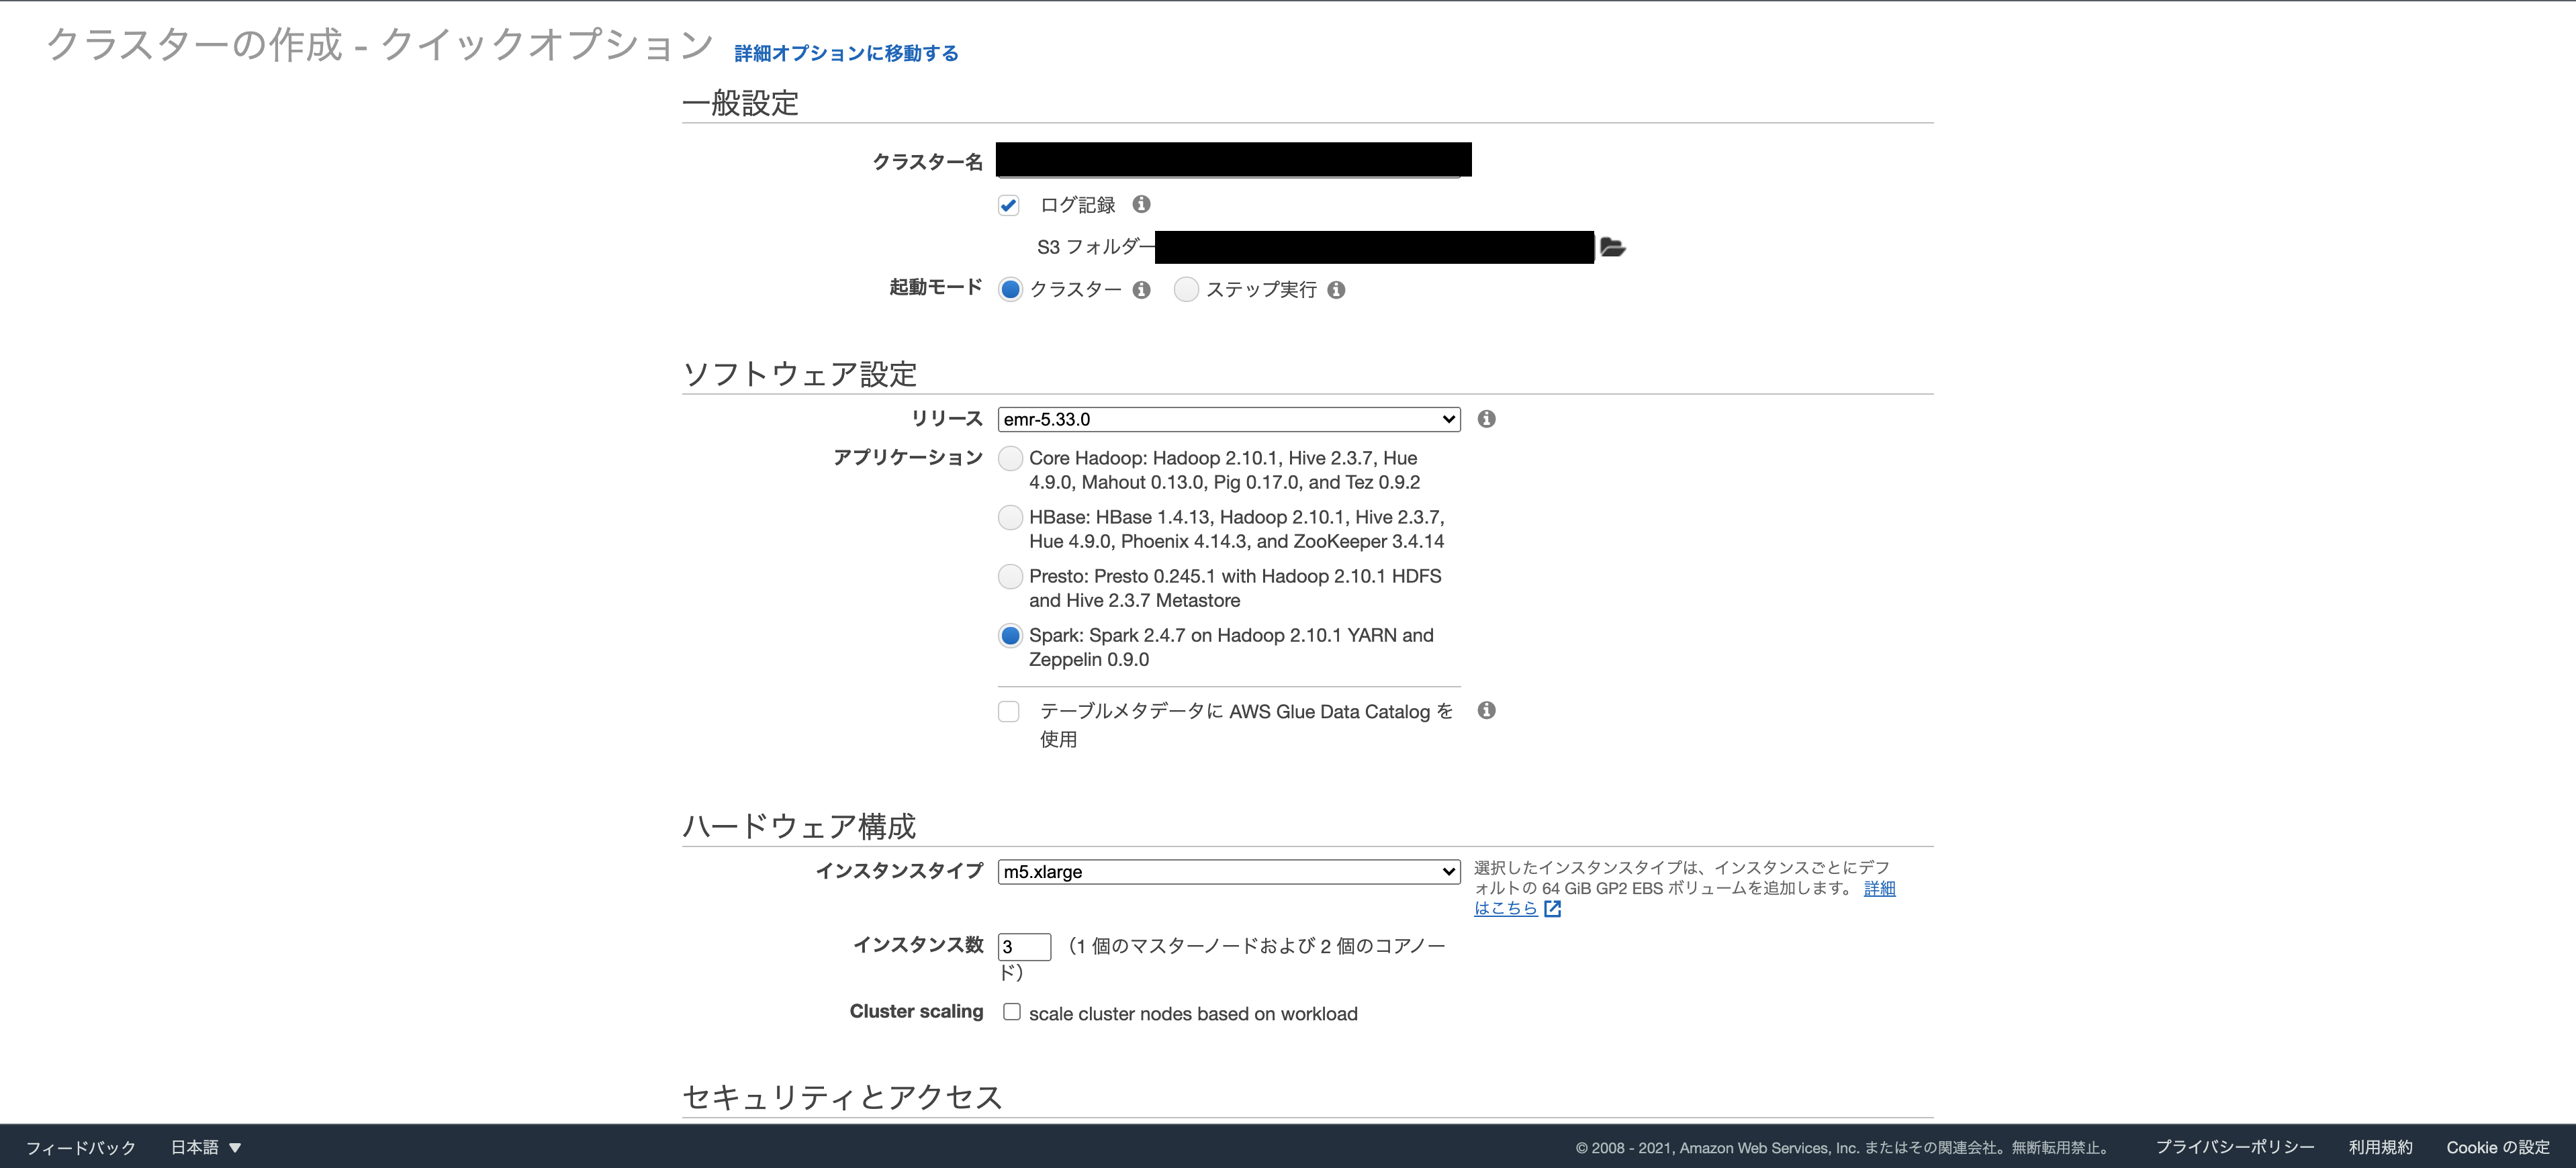
EMR作成
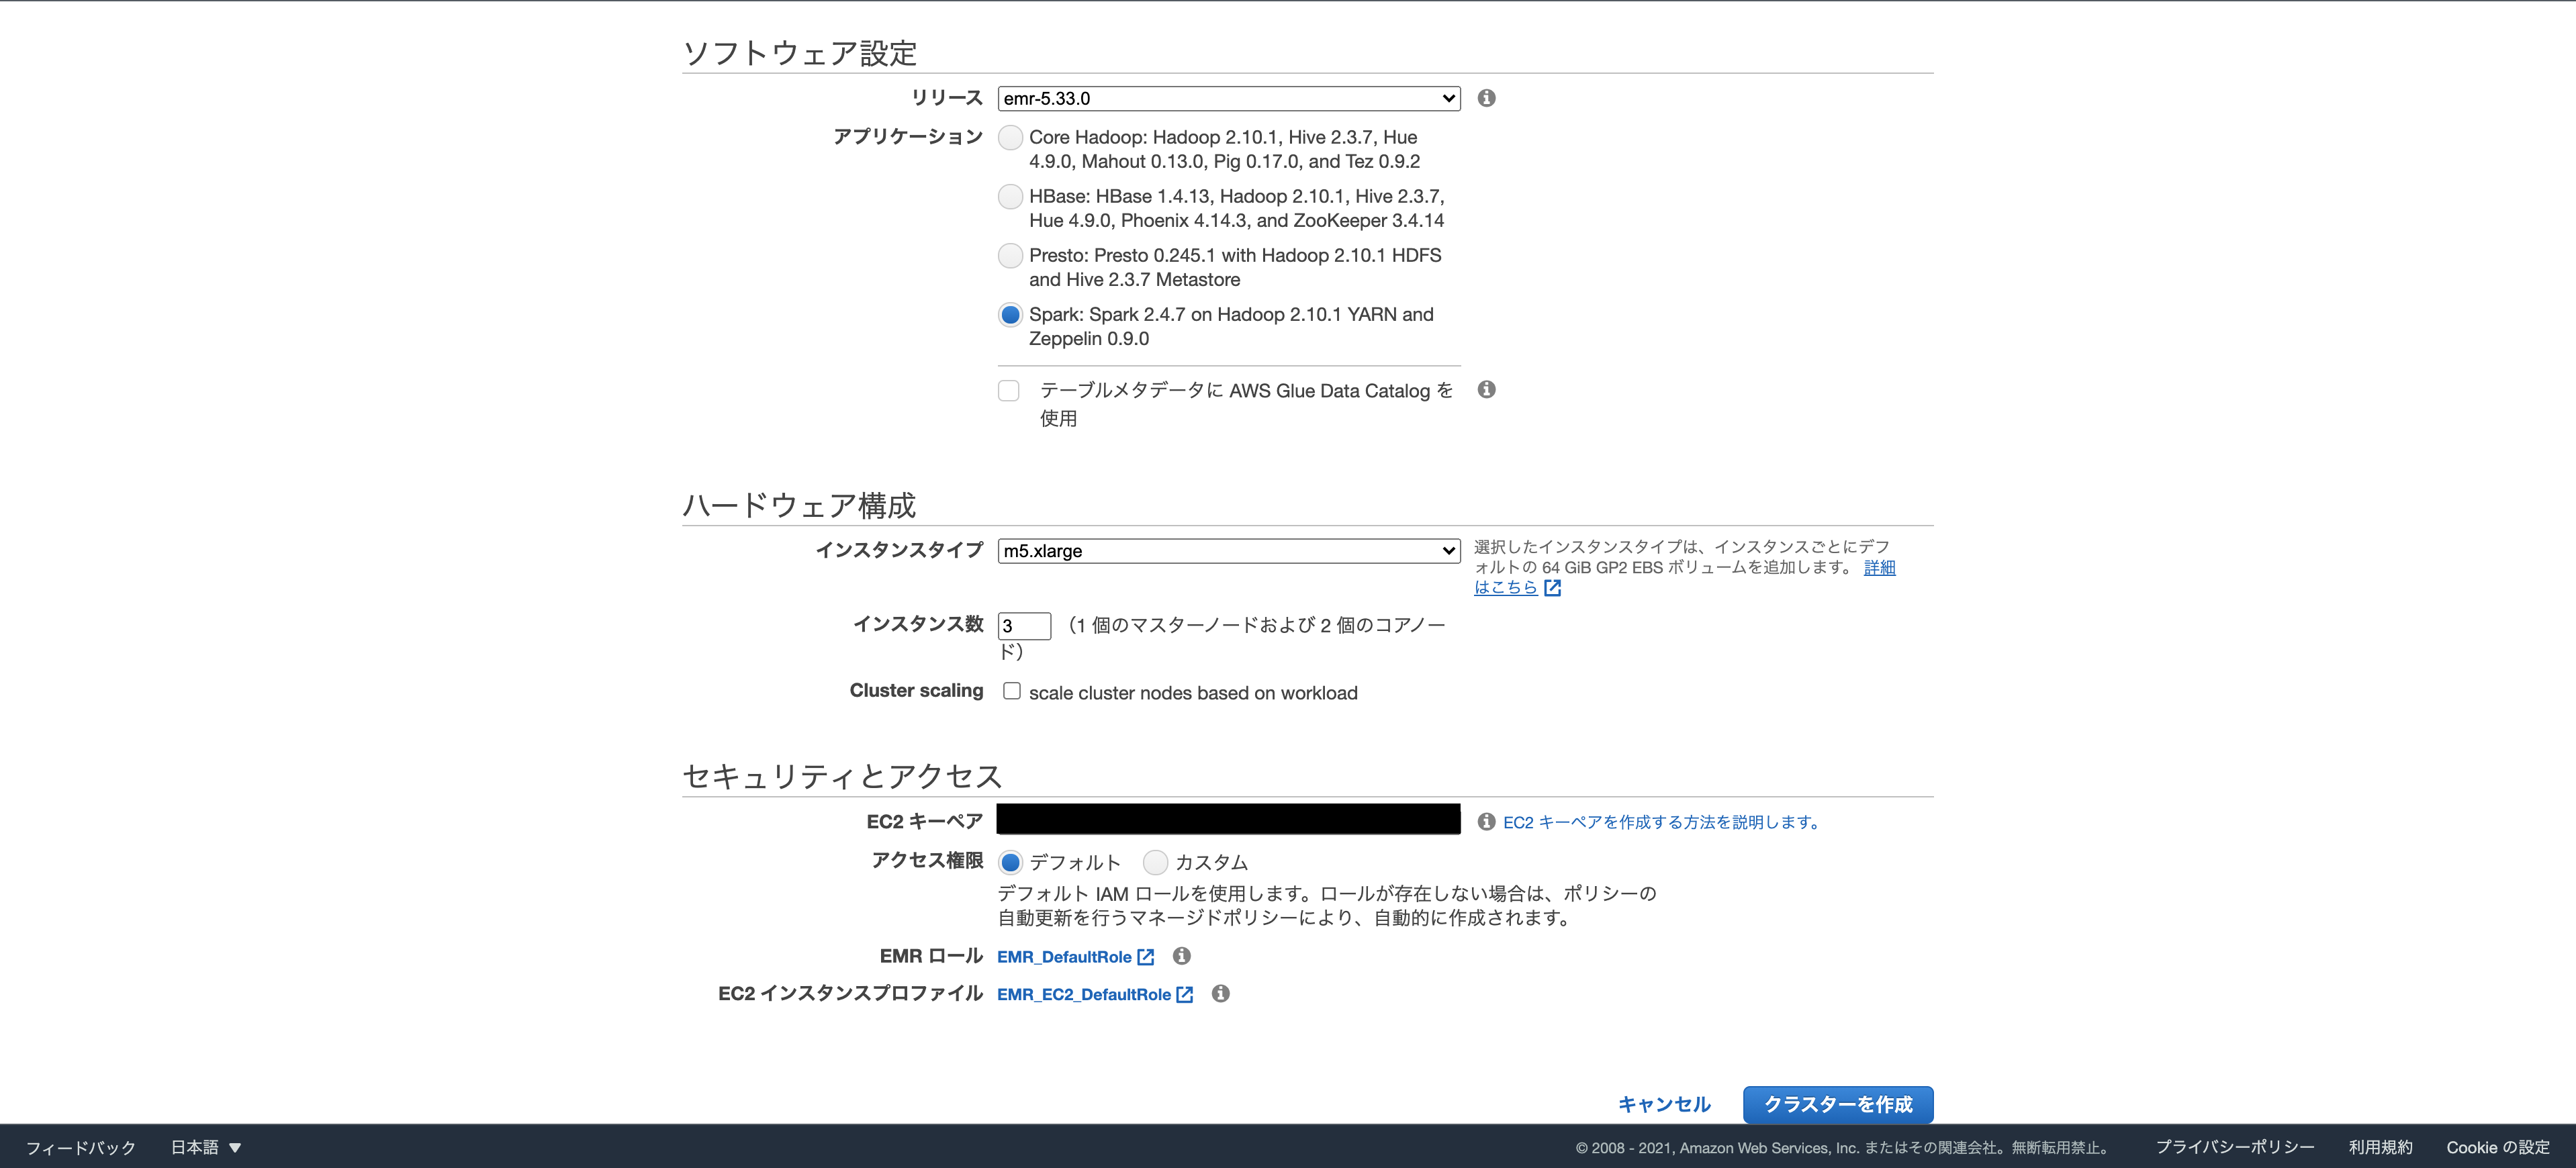
デフォルトで3つのノード(1つのマスターノードと2つのコアノード)を設定されます。
実行時に、マスターノードはデータセットの処理を処理するコアノードにワークロードを分散します。
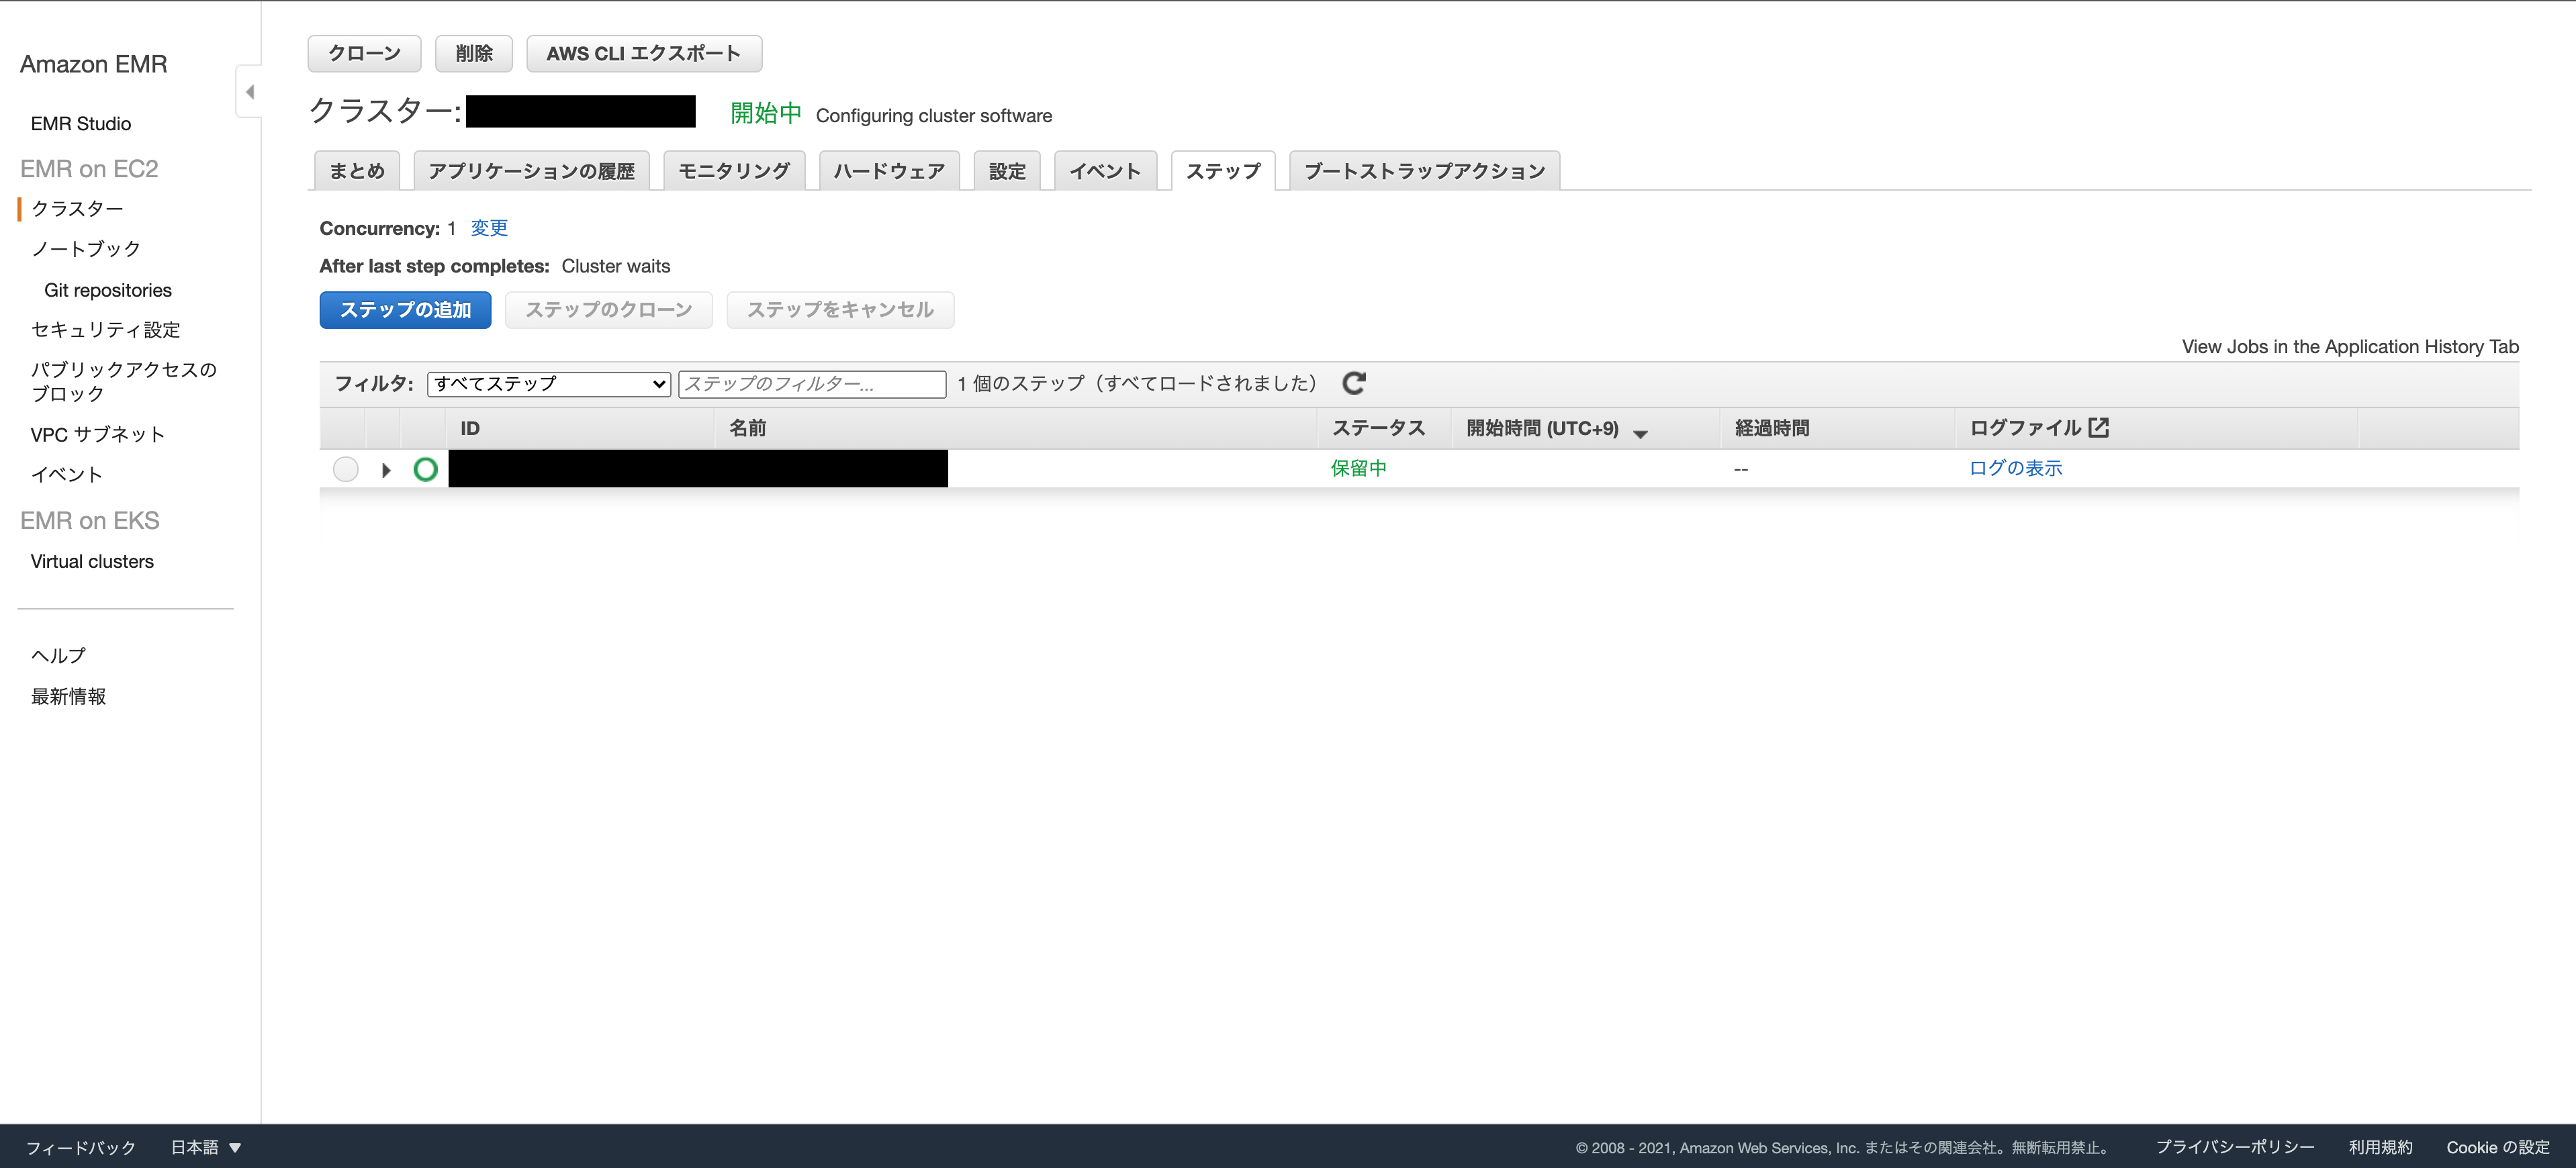
EMR クラスターを調整
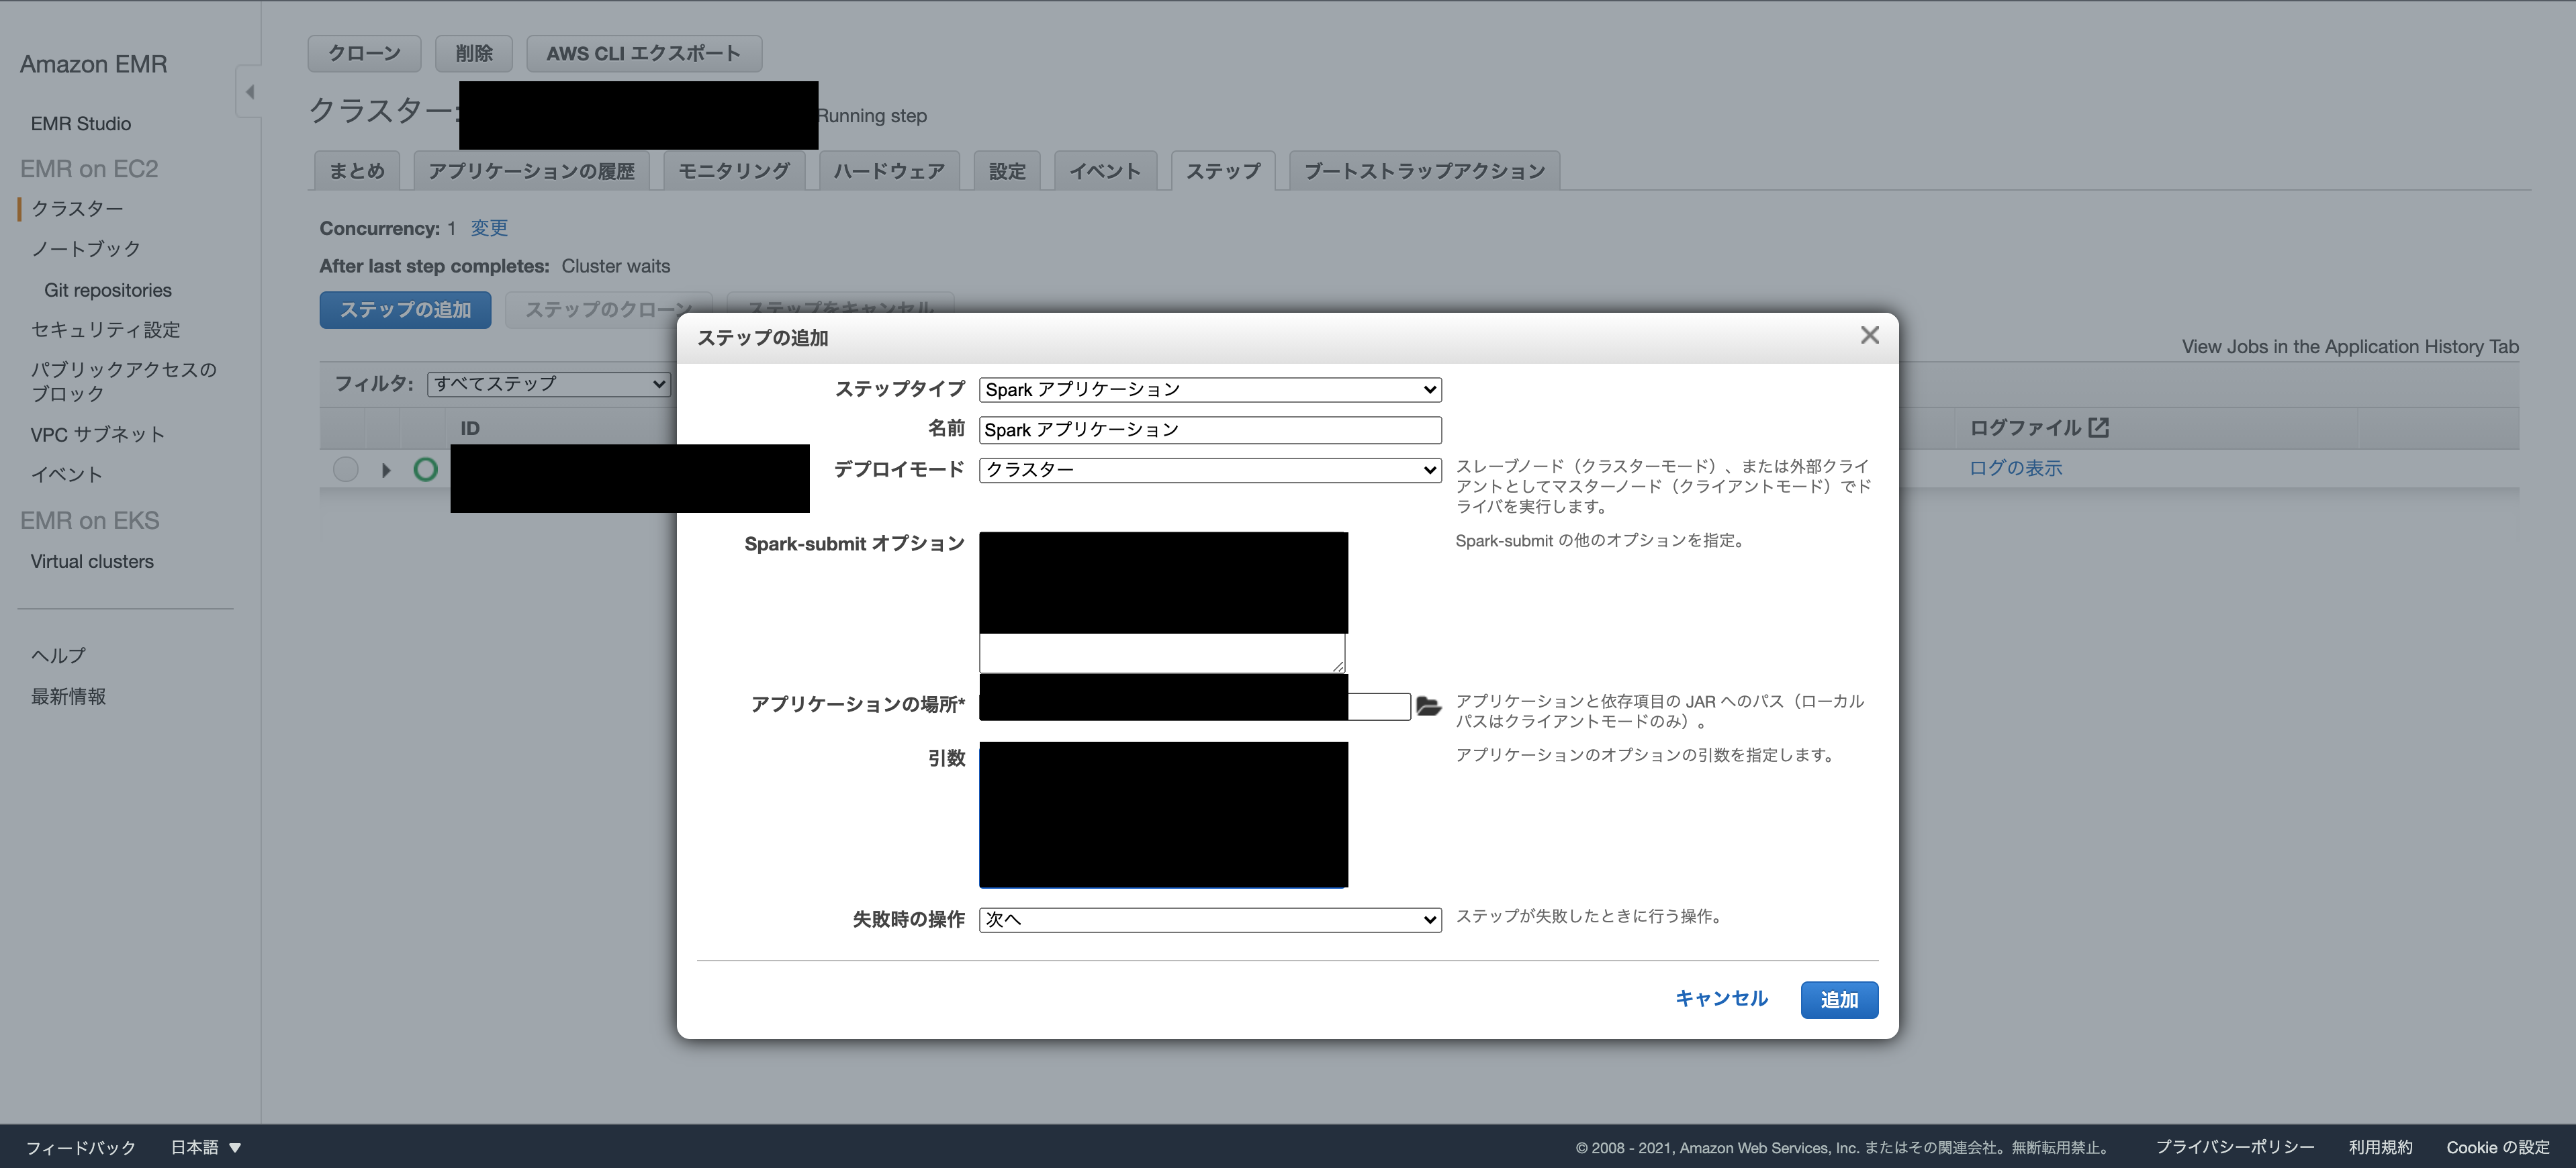
[Steps (ステップ)]、[Add step (ステップの追加)] の順に選択します。
アプリケーションの場所:S3に入れたPySparkスクリプトの場所
引数:
--data_source s3://作成したバケット名/script/food_establishment_data.csv
--output_uri s3://作成したバケット名/output
結果の表示
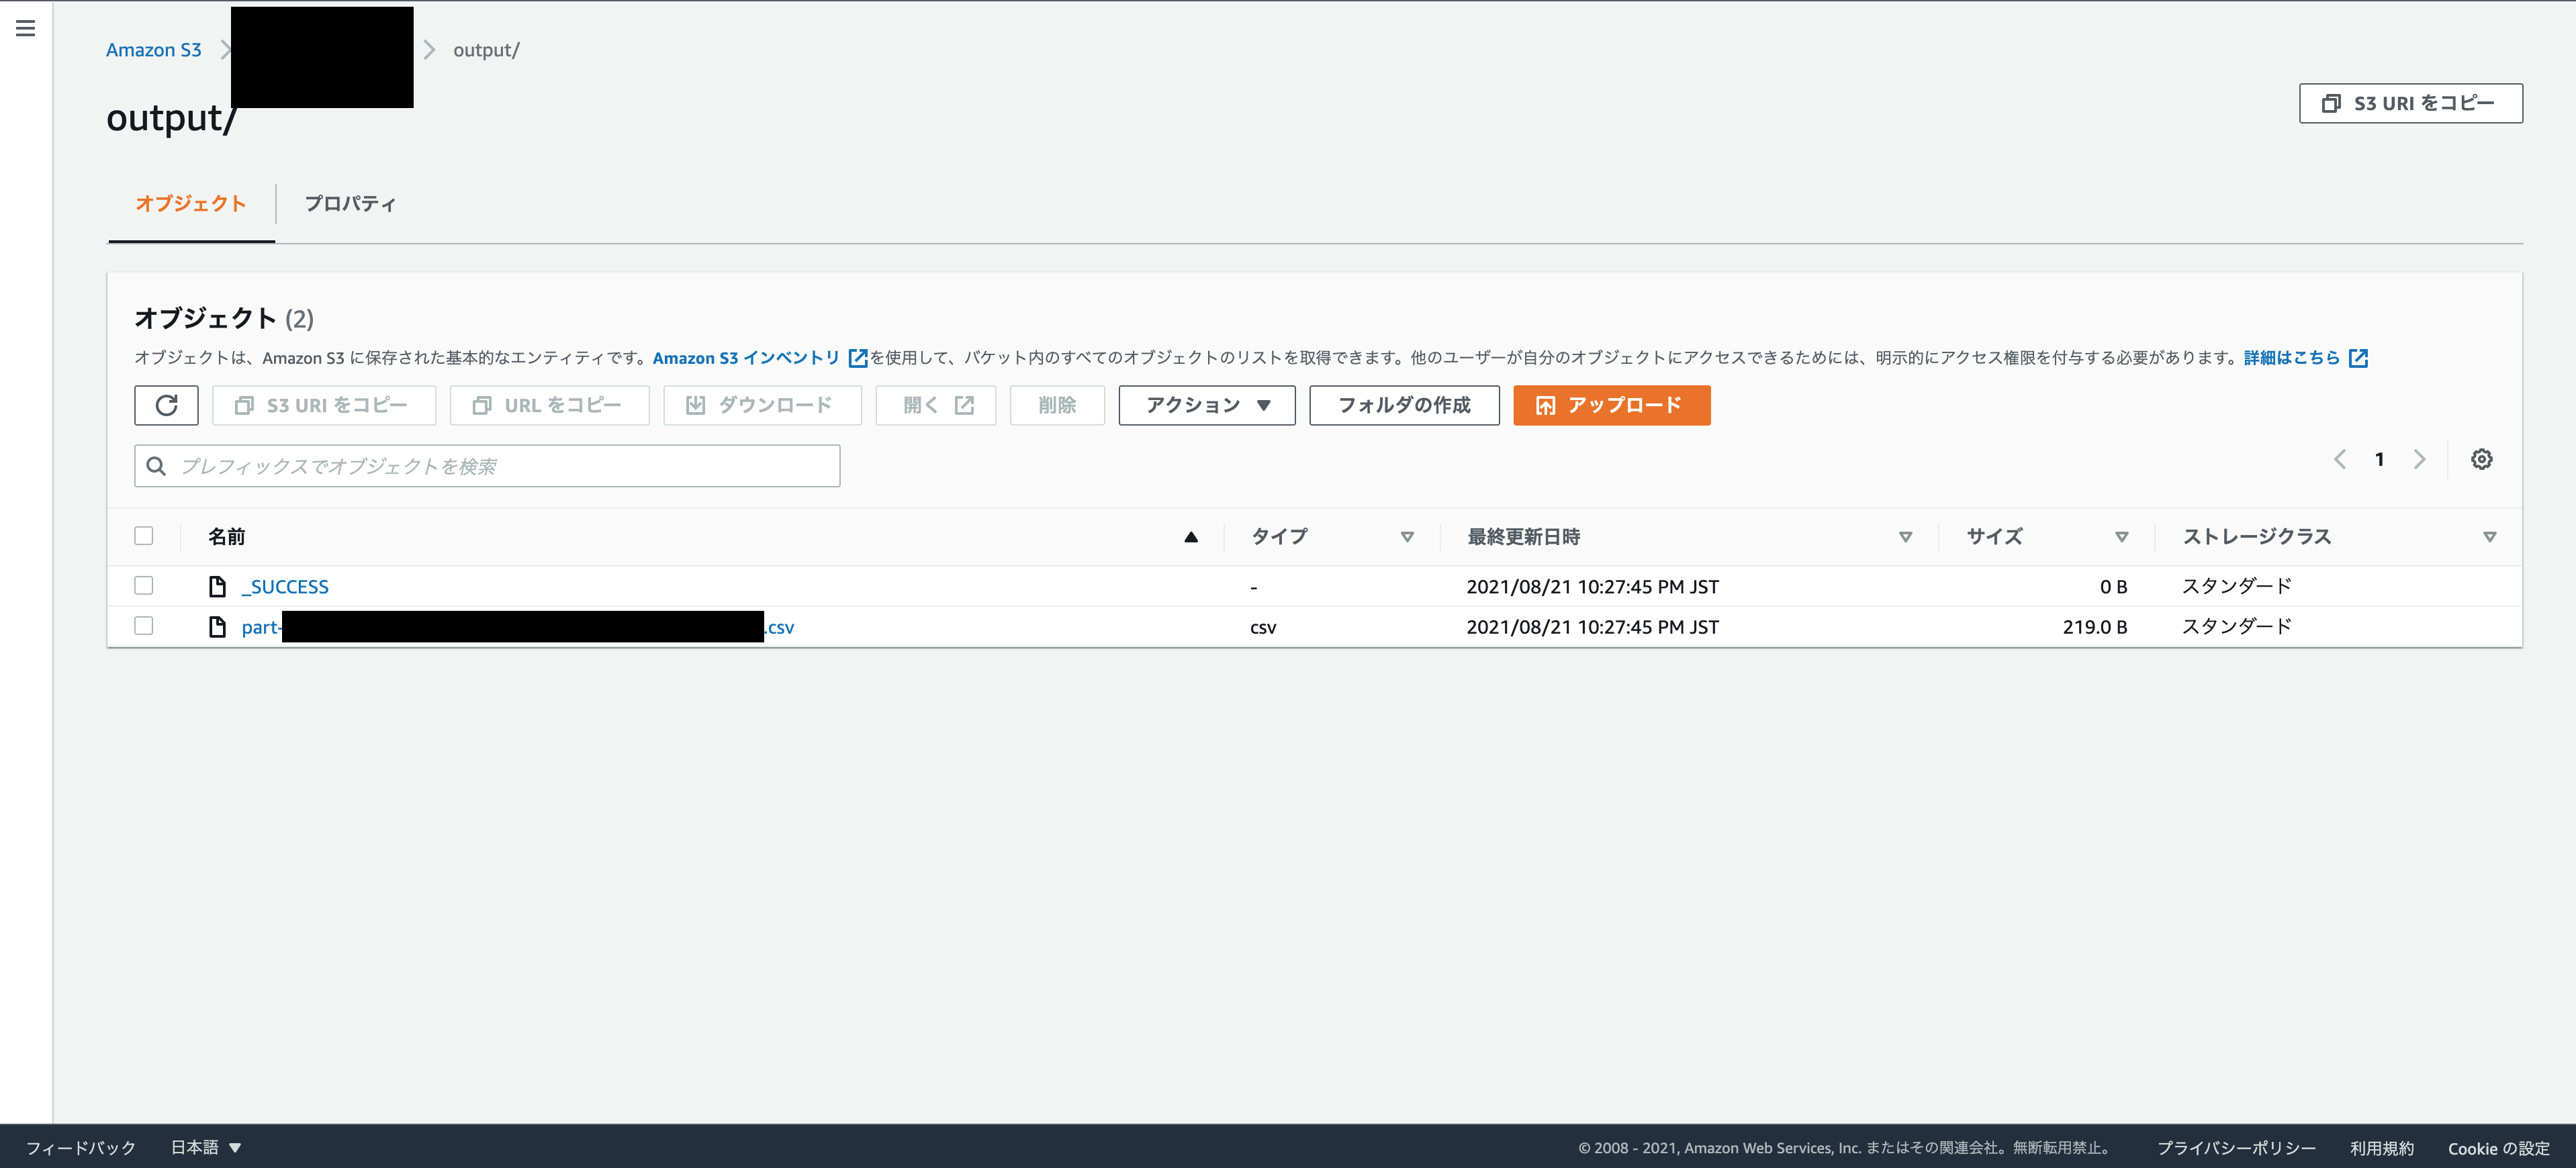
ステップが正常に実行されると、ステップの送信時に指定した Amazon S3 出力フォルダに出力結果を表示できます。
次の項目が出力フォルダにあることを確認します。
_SUCCESS
ステップの成功を示します。
CSVファイルpart-***
結果を持つオブジェクトです。
なんと、pyファイルは、出力ファイルに、最も赤い違反が多い食品施設の上位 10 件がリストするものでした(!?)
面白いです。
name, total_red_violations
SUBWAY, 322
T-MOBILE PARK, 315
WHOLE FOODS MARKET, 299
PCC COMMUNITY MARKETS, 251
TACO TIME, 240
MCDONALD'S, 177
THAI GINGER, 153
SAFEWAY INC #1508, 143
TAQUERIA EL RINCONSITO, 134
HIMITSU TERIYAKI, 128
EMR リソースのクリーンアップ
EMRを終了するを押下します。
5 ~ 10 分かかる場合があります。
S3 リソースを削除します。
バケットを削除する前に、クラスターを完全にシャットダウンする必要があります。そうしないと、バケットを空にしようとすると問題が発生する可能性があります。
総括
最初の Amazon EMR クラスターを最初から最後まで起動し、ビッグデータアプリケーションの準備と送信、結果の表示、クラスターのシャットダウンなど、EMR 諸々を実行しました。
なんとなくイメージを掴むにはハンズオンが一番ですね。
今回はAWSから提供されているファイルを使用しましたが、COVID-19 Dataset by Our World in DataというGit Hubから、データを使って分析してみるのも面白いかもしれません。
参考
https://docs.aws.amazon.com/ja_jp/emr/latest/ManagementGuide/emr-gs.html
https://github.com/owid/covid-19-data
