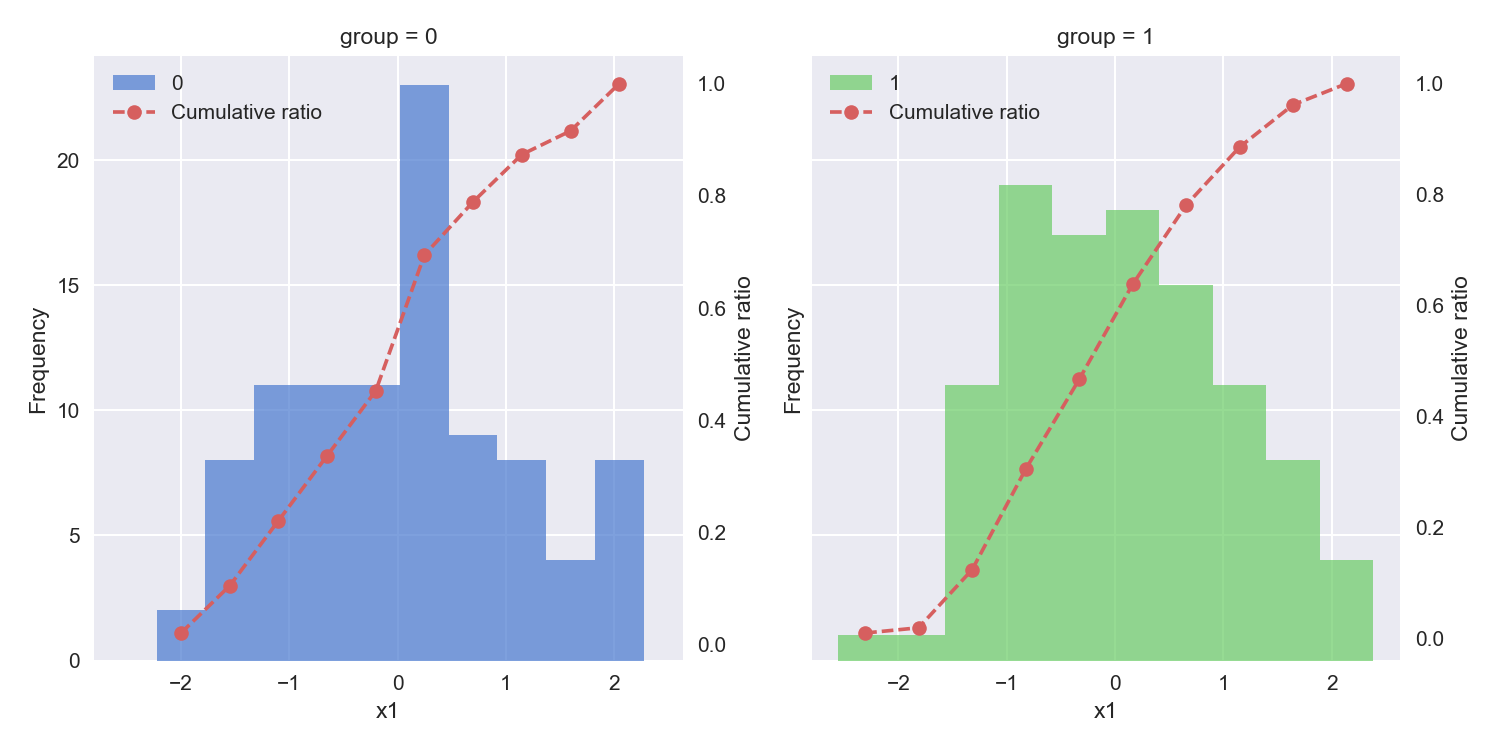
pyplot.hist()に対して、累積比率の線を重ねる方法はここで書きました。今回はseaborn.FacetGrid()を使って描いた複数のヒストグラムに累積比率を重ねてみます。以下、完成プロット。
やる事は、ここと変わりませんが、seaborn.FacetGrid()やseaborn.distplot()を使ってヒストグラムを描く場合、pyplot.hist()の様にビンや度数の情報を戻り値として明示的に受け取れません。そこでaxオブジェクトからゴニョゴニョしてビンや度数の情報を抽出します。具体的には、axに含まれるpatchesオブジェクトから必要な情報を取り出します。基本のコードは以下
"""FacetGridのヒストグラムに累積比率の線を重ねる"""
import numpy as np
import pandas as pd
import matplotlib.pyplot as plt
import seaborn as sns

# % matplotlib inline
sns.set(style="darkgrid", palette="muted", color_codes=True)

# トイデータ生成
np.random.seed(0)

size = 200
x1 = np.random.normal(size=size)
group = np.random.choice((0, 1), size=size)
df = pd.DataFrame({'x1': x1, 'group': group})

# seaborn.FacetGrid()で複数のヒストグラムを生成
g = sns.FacetGrid(data=df, col='group', hue='group', size=5)
g = g.map(plt.hist, 'x1', alpha=0.7, label='Frequency')


# FacetGridに含まれるすべてのaxに対して、累積線を描く
for ax in g.axes.ravel():

    # patchesを抽出
    patches = ax.patches

    # 第2軸の値を計算(x)
    bins_part = [patch.get_xy()[0] + patch.get_width() for patch in patches]
    bins = [patches[0].get_xy()[0]] + bins_part
    x2 = np.convolve(bins, np.ones(2) / 2, mode="same")[1:]

    # 第2軸の値を計算(y:累積)
    n = [patch.get_height() for patch in patches]
    y2 = np.add.accumulate(n) / sum(n)

    # 第2軸のプロット
    ax2 = ax.twinx()
    ax2.plot(x2, y2, ls='--', marker='o', color='r',
                     label='Cumulative ratio')
    ax2.grid(visible=False)


plt.tight_layout()
plt.show()
凡例なども含めた完全版のコードはGistにおいてます。ここからどうぞ。