下図のようにヒストグラムに累積度数や比率など重ねてプロットしたくなるのでメモ。
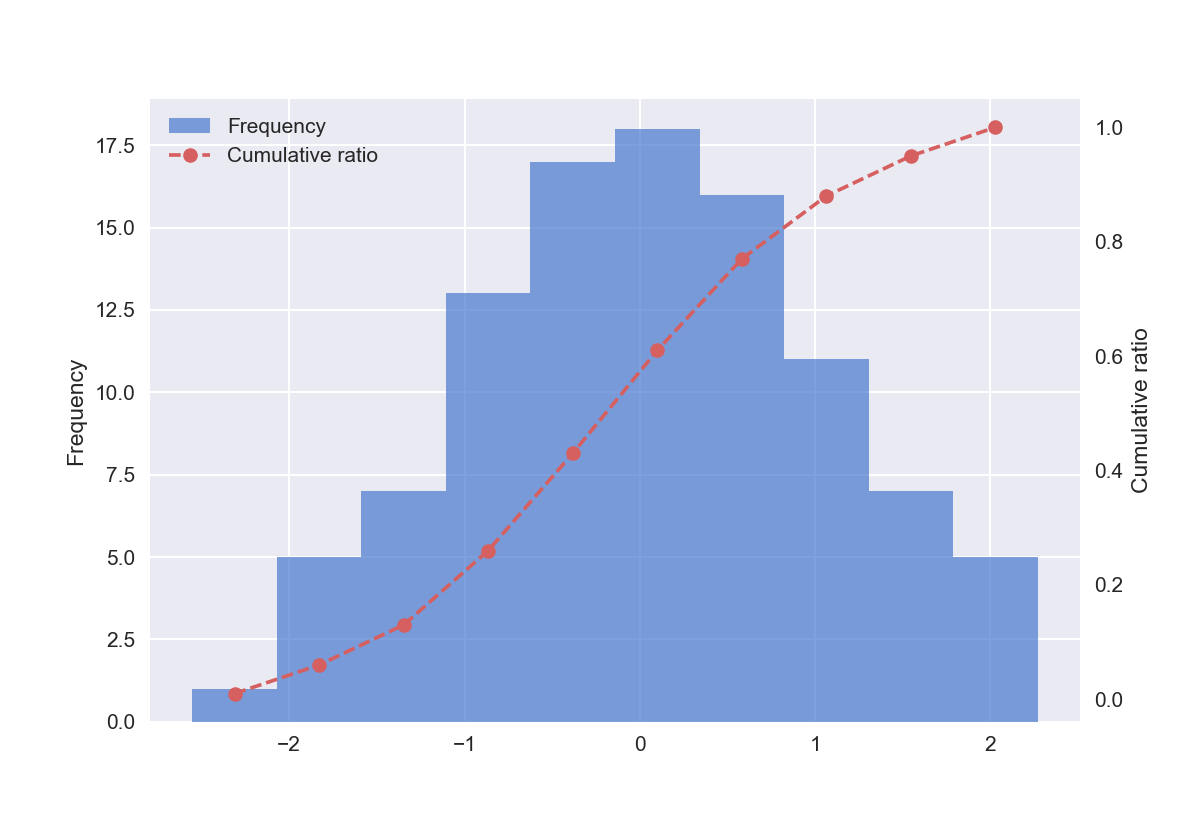
ヒストグラムのプロット時、pyplot.hist()の戻り値で度数やビンの情報を取得できるので、それを使って第2軸に累積比率を計算して、適切な場所に重ねる。コードは以下(主要な部分のみ)
"""ヒストグラムに累積比率を追加する"""
import numpy as np
import matplotlib.pyplot as plt
import seaborn as sns

# % matplotlib inline
# seabornのスタイルでプロット
sns.set(style="darkgrid", palette="muted", color_codes=True)

# トイデータ生成
np.random.seed(0)
dt = np.random.normal(size=100)

fig, ax1 = plt.subplots()

# ヒストグラムプロットとビン情報の取得
n, bins, patches = ax1.hist(dt, alpha=0.7, label='Frequency')

# 第2軸用値の算出
y2 = np.add.accumulate(n) / n.sum()
x2 = np.convolve(bins, np.ones(2) / 2, mode="same")[1:]

# 第2軸のプロット
ax2 = ax1.twinx()
lines = ax2.plot(x2, y2, ls='--', color='r', marker='o',
         label='Cumulative ratio')
ax2.grid(visible=False)

plt.show()
凡例とかちゃんと付けたい方こちらに完全版あります。seaborn.FacetGrid()使う場合はどうやるんでしょうね
maplotlibのヒストグラムに累積比率を追加する2 〜FacetGridを使う〜