はじめに
重回帰分析を試します。
環境は以下の通り。
- MacBook (Retina, 12-inch, Early 2015)
- プロセッサMacBook (Retina, 12-inch, Early 2015)
- メモリ8 GB 1600 MHz DDR3
- Python 3.6.5
- scikit-learn 0.21.2
- notebook 5.5.0
手順
- データセットの読み込み
- 入力変数と出力変数を切り分け
- 学習データと検証データに分割
- モデルの宣言
- モデルの学習
- モデルの検証
- 学習済みモデルを用いて予測値を計算
必要ライブラリのインストール
pip install jupyter
pip install numpy
pip install pandas
pip install matplotlib
pip install scikit-learn
データを準備
from sklearn.datasets import load_boston
boston = load_boston()
まずはデータの読み込み。
scikit-learnの中にあるボストンの住宅データを用いて重回帰を試みます。
sklearn.datasets の中に load_boston というボストン近郊の住宅データを取り込みます。
print(boston.DESCR)
# 出力 データセットの説明
---
:Attribute Information (in order):
        - CRIM     per capita crime rate by town
        - ZN       proportion of residential land zoned for lots over 25,000 sq.ft.
        - INDUS    proportion of non-retail business acres per town
        - CHAS     Charles River dummy variable (= 1 if tract bounds river; 0 otherwise)
        - NOX      nitric oxides concentration (parts per 10 million)
        - RM       average number of rooms per dwelling
        - AGE      proportion of owner-occupied units built prior to 1940
        - DIS      weighted distances to five Boston employment centres
        - RAD      index of accessibility to radial highways
        - TAX      full-value property-tax rate per $10,000
        - PTRATIO  pupil-teacher ratio by town
        - B        1000(Bk - 0.63)^2 where Bk is the proportion of blacks by town
        - LSTAT    % lower status of the population
        - MEDV     Median value of owner-occupied homes in $1000's
----
データセットの確認。
boston.keys()
# 出力
dict_keys(['data', 'target', 'feature_names', 'DESCR', 'filename'])

# 入出力の切り分け
x = boston['data']  # 物件の情報
t = boston['target']  # 家賃
# 行列のサイズ確認
x.shape
# 出力
(506, 13)
サンプル数が506、入力変数(説明変数)が13ことを確認
出力変数(目的変数)は変数tへ代入
重回帰分析の実装
from sklearn.model_selection import train_test_split
x_train, x_test, t_train, t_test = train_test_split(x, t, test_size=0.3, random_state=0)
過学習を防ぐために訓練データと検証データに分割。
今回は訓練データ7割、検証データ3割でランダムに分割。
そして、ランダムを同じランダムにするために random_state を 0 に固定。
from sklearn.linear_model import LinearRegression
model = LinearRegression()
scikit-learnの linear_model (線形モデル)の中に LinearRegresssion (線形回帰)があるので、そちらをインポート。
そしてモデルを宣言。
model.fit(x_train, t_train)
# 出力
LinearRegression(copy_X=True, fit_intercept=True, n_jobs=None, normalize=False)

model.score(x_train, t_train)
# 出力
0.7645451026942549

model.score(x_test, t_test)
# 出力
0.6733825506400183
モデルの学習。もっているデータから適切なパラメータを求める
出来上がったモデルの評価。1に近い方がよりよいモデル。
学習データと検証データ両方の評価を実施。
訓練データと検証データに対しての評価がほぼおなじ精度となっているため、過学習は起きていない。
推論
x0 = x[0]  # 新しいサンプル
x0
# 出力
array([6.320e-03, 1.800e+01, 2.310e+00, 0.000e+00, 5.380e-01, 6.575e+00,
       6.520e+01, 4.090e+00, 1.000e+00, 2.960e+02, 1.530e+01, 3.969e+02,
       4.980e+00])

model.predict([x0])
# 出力
array([30.29079542])
家賃予測完了。…
おまけ
Pandasをつかってデータ分析
参考サイト:https://momonoki2017.blogspot.com/2018/01/scikit-learn_28.html
import pandas as pd
boston_df = pd.DataFrame(boston.data, columns=boston.feature_names)# 説明変数(data)
boston_df['PRICE'] = boston.target # 目的変数(target)追加
boston_df.head()
PLSによる次元削減
本データセットの場合はあまり有効ではありませんがPLSによる次元削減の方法も紹介させていただきます。
有効な場面は下記になります。
-入力変数の数が膨大
-入力変数同士の相関が強い
from sklearn.cross_decomposition import PLSRegression
model = PLSRegression(n_components=8)#n_composentesに任意の値を代入できます。
model.fit(x_train, t_train)
# 出力
PLSRegression(copy=True, max_iter=500, n_components=8, scale=True, tol=1e-06)

model.score(x_train, t_train)
# 出力
0.764473422568412

model.score(x_test, t_test)
# 出力
0.6730412959375665
次元削減は有効ですがパラメータが多い場合は一つずつ確認するのは大変ですよね。
グリッドサーチならそれを機械がやってくれます
グリッドサーチ
from sklearn.model_selection import GridSearchCV
params = {'n_components': list(range(1, 14))}
params
# 出力
{'n_components': [1, 2, 3, 4, 5, 6, 7, 8, 9, 10, 11, 12, 13]}
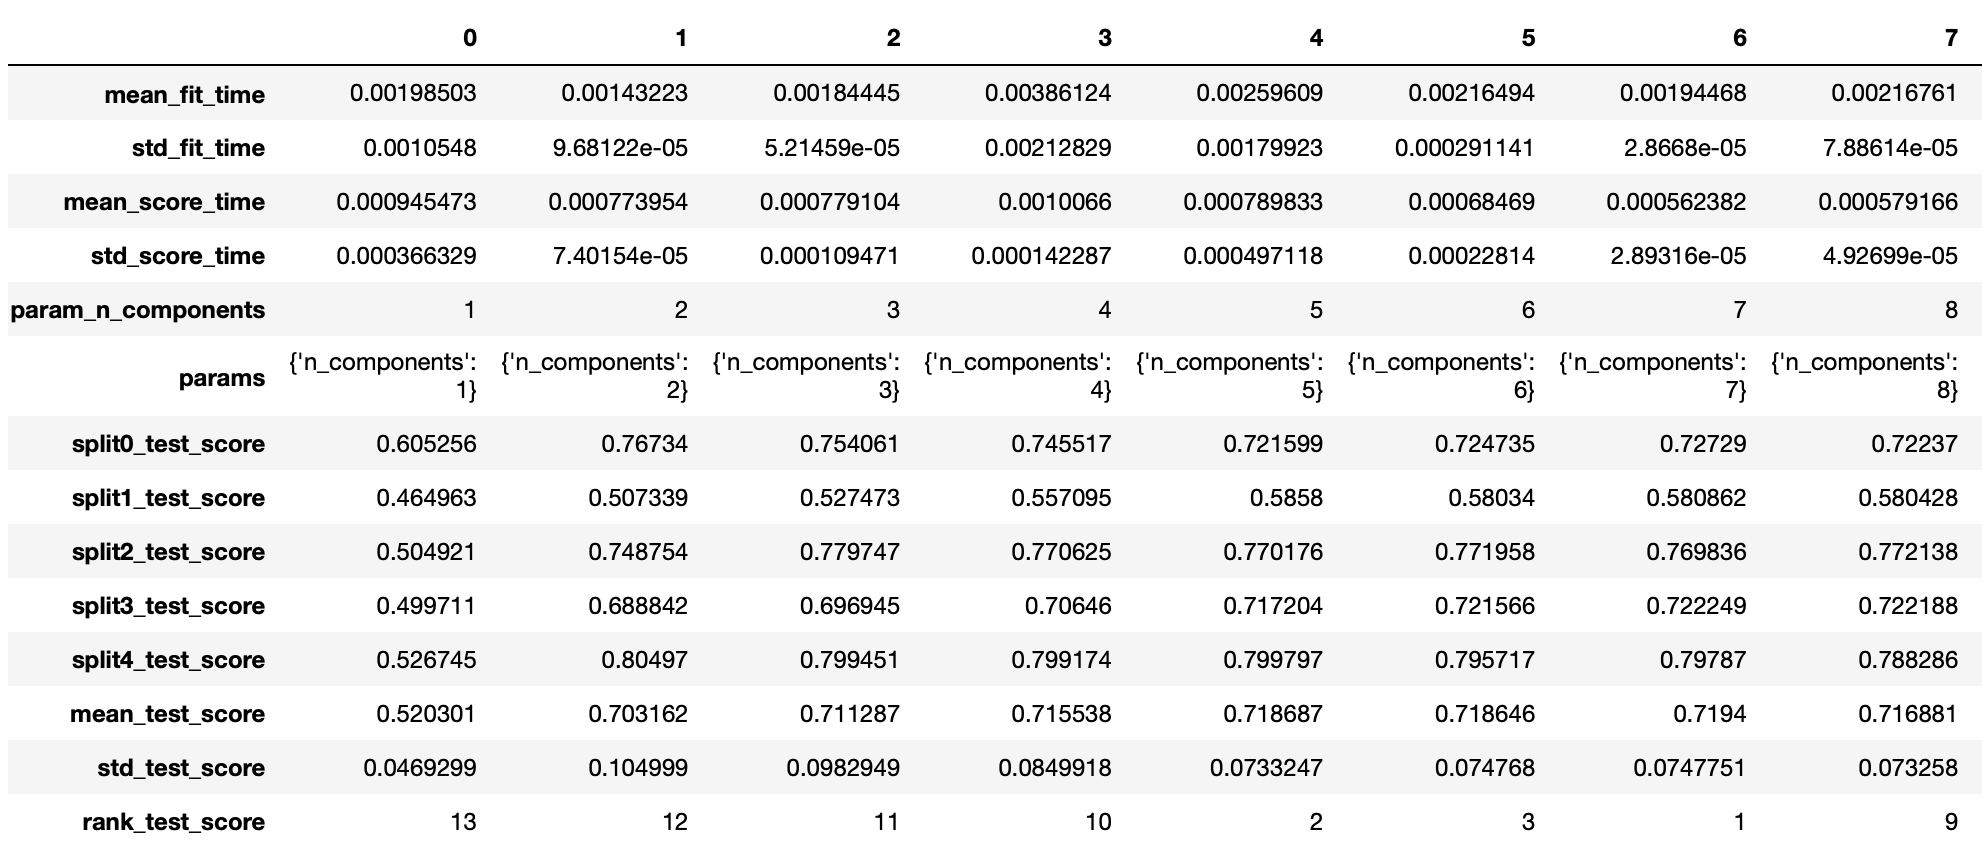
グリッドサーチとクロスバリデーションしたいハイパーパラメータ候補をセット。
model_cv= GridSearchCV(PLSRegression(), params, cv=5, return_train_score=False)
model_cv.fit(x_train, t_train)
pd.DataFrame(model_cv.cv_results_).T
# 最適なハイパーパラメータは?
model_cv.best_params_
# 出力
{'n_components': 7}
最適なパラメータがわかりました。
model.score(x_train, t_train)
# 出力
0.7640687657102856

model.score(x_test, t_test)
# 出力
0.6730412959375665
パラメータが13個しかないのでグリッドサーチをしてもあまり変わりませんね。
パラメータが大量にあれば非常に有効なんだと思います。
最後に
読んでいただきありがとうございます。
もし間違い等ありましたらご連絡いただければと思います。

