環境/前提
Kubernetes: v1.23
以下をクラスター上にデプロイ済み
PrometheusOperator(HelmChart): kube-prometheus-stack-36.2.1
Linkerd: v2.11
Jaeger all-in-one(HelmChart): linkerd-jaeger-2.11.3stable-2.11.3
本題
結論
ServerAuthorizationを編集する必要があった
概要
Jaeger all-in-oneによるとポート14269で/metricsエンドポイントにてメトリックスがスクレイプされるよう用意されている
確かにJaegerのPodの中身を見ると確かにそんな感じがする
apiVersion: v1
kind: Pod
metadata:
  annotations:
    prometheus.io/path: /metrics
    prometheus.io/port: "14269"
    prometheus.io/scrape: "true"
...
Serviceとしては公開されていない
NAME              TYPE        CLUSTER-IP      EXTERNAL-IP   PORT(S)                                           AGE
jaeger            ClusterIP    10.233.44.125   <none>        14268/TCP,14250/TCP,16686/TCP   2d3h
が、PodMonitorがあるので問題ないだろう
PodMonitorを作成
作成したPodMonitorがこちら
apiVersion: monitoring.coreos.com/v1
kind: PodMonitor
metadata:
  labels:
    team: jaeger
  name: jaeger
  namespace: linkerd-jaeger
spec:
  namespaceSelector:
    matchNames:
    - linkerd-jaeger
  podMetricsEndpoints:
  - interval: 5s
    path: /metrics
    port: admin
  selector:
    matchLabels:
      component: jaeger
      linkerd.io/control-plane-ns: linkerd
      linkerd.io/extension: jaeger
      linkerd.io/proxy-deployment: jaeger
      linkerd.io/workload-ns: linkerd-jaeger
これをデプロイしたがメトリックスが取得できない
linkerd-proxyのログを見たらRequest deniedされてた
...
[  1993.963968s]  INFO ThreadId(01) inbound:server{port=14269}: linkerd_app_inbound::policy::authorize::http: Request denied server=jaeger-admin tls=Some(Established { client_id: Some(ClientId(Name("prometheus-operator-kube-p-prometheus.monitoring.serviceaccount.identity.linkerd.cluster.local"))), negotiated_protocol: None }) client=10.233.92.74:40682
[  1993.964065s]  INFO ThreadId(01) inbound:server{port=14269}:rescue{client.addr=10.233.92.74:40682}: linkerd_app_core::errors::respond: Request failed error=unauthorized connection on server jaeger-admin
...
ちゃんとエンドポイントにアクセスしに行っていると安心しつつ、検索したらこのIssueにたどり着いた
ServerAuthorizationを編集
jaeger-adminのServerAuthorizationを編集して
apiVersion: policy.linkerd.io/v1beta1
kind: ServerAuthorization
metadata:
(省略)
spec:
  client:
    meshTLS:
      serviceAccounts:
      - name: prometheus-operator-kube-p-prometheus #自分の環境にしてね
        namespace: monitoring #自分の環境にしてね
  server:
    name: jaeger-admin
ログを見に行くと新しいエラーも吐いてなくてPrometheus見に行ったら
結果
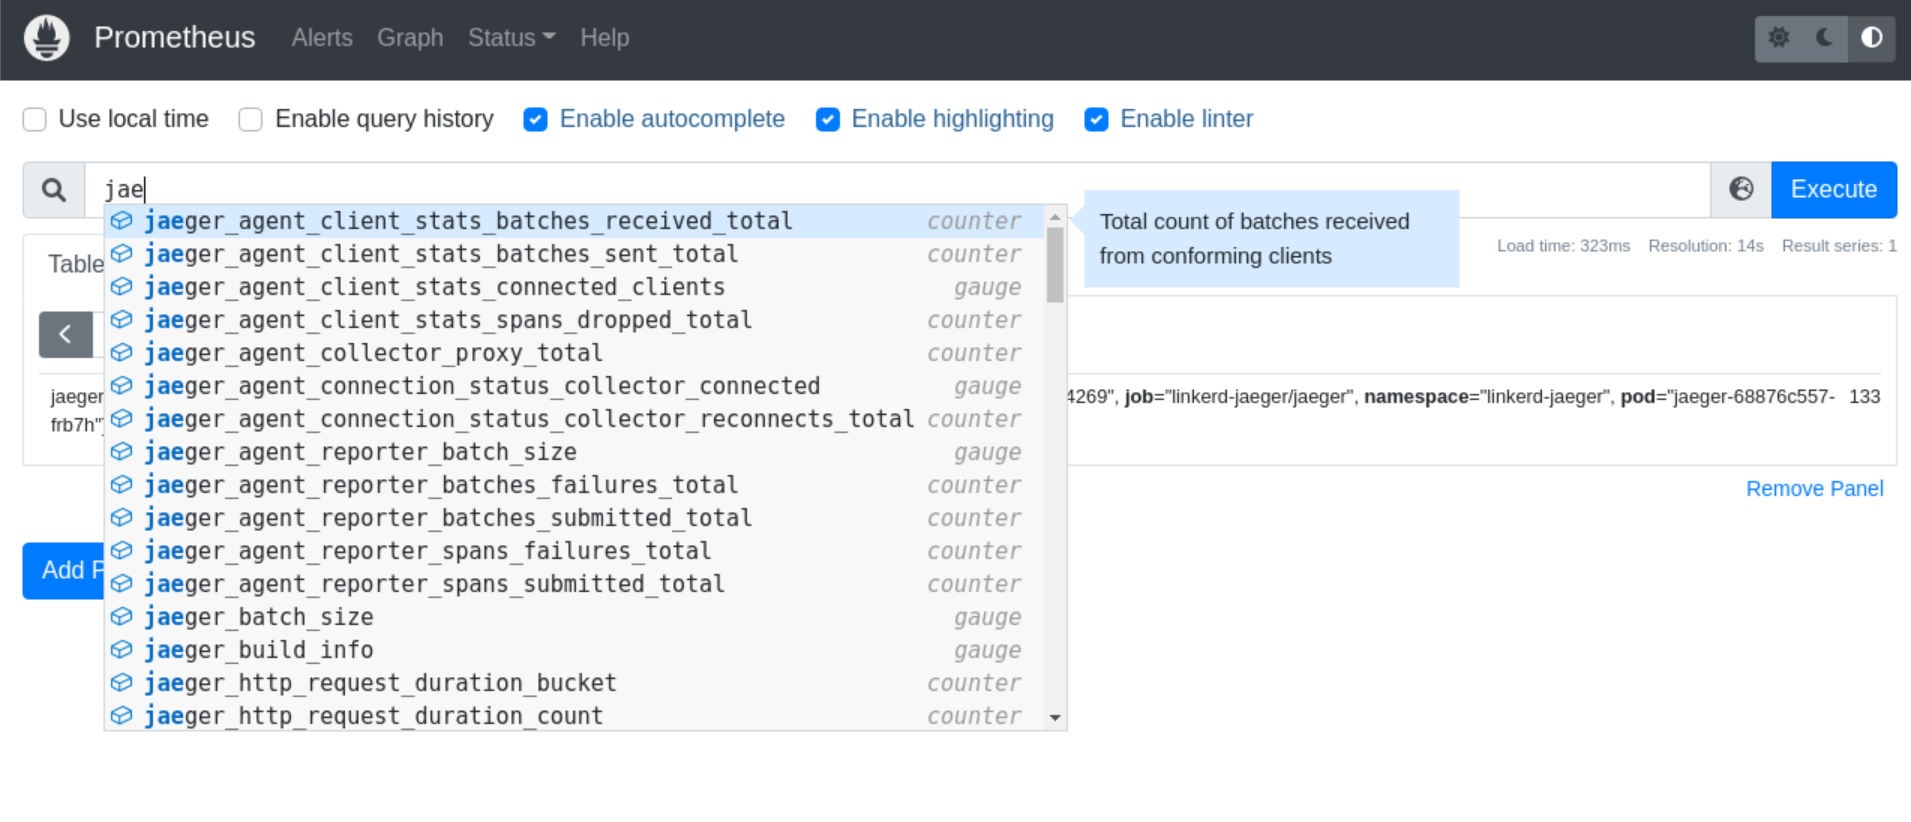
できてる!!!!!!
参考
https://www.jaegertracing.io/docs/1.34/monitoring/
https://github.com/linkerd/linkerd2/issues/7339