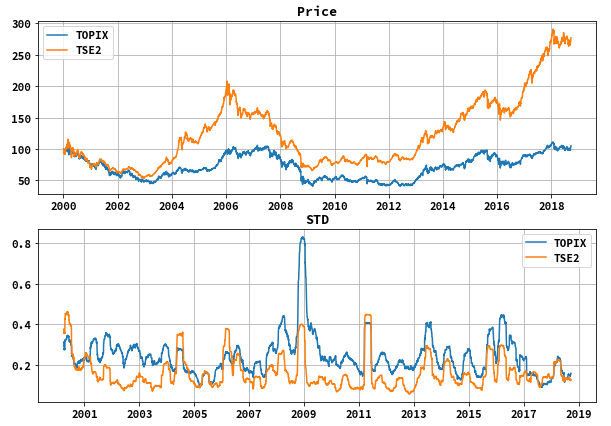
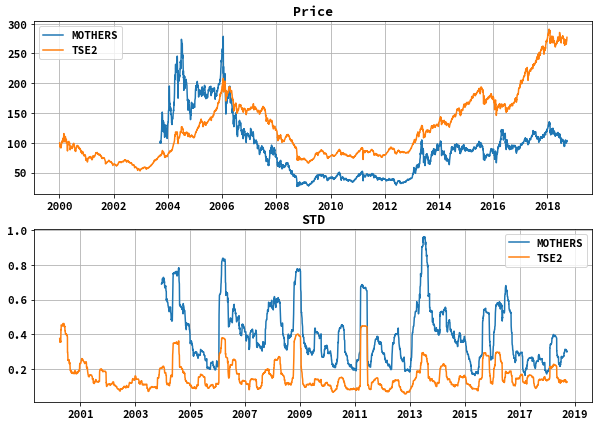
昨日自分のはてなブログで「東証2部最強やなという話」を書きました。この記事はTOPIX指数、東証2部指数、マザーズ指数のデータをダウンロードして加工し、各々の価格データを指数化したものと標準偏差を比べ見て、東証2部指数が最強やなみたいな記事を作りました。(決して投資を推奨するわけではありません。そうして、TOPIX,マザーズ指数に投資する方法はたくさんありますが(投資信託、ETF、先物など)、東証2部指数に投資する方法は筆者が知る限りありません。)
最強やなというところで使ったグラフは以下のものでmatplotlibで書きました。
そのコードを以下では書いていきます。
まず価格データに関しては、SBI証券よりダウンロードしました。TOPIX、東証2部指数に関しては2000年からのデータをcsvでできました。マザーズ指数に関しては、算出が2003年9月12日ということで、その日からのデータしかありませんでした。
# ローカルにダウンロードしたCSVを4本足と出来高だけ取る。日付は文字列なのでパースする。ウィンドウズなのでencoding='cp932'を忘れない。
def get_csv(ind_name):
    df = pd.read_csv('{}.csv'.format(ind_name), parse_dates = ['日付'], index_col = '日付',
    header=0,  encoding='cp932').sort_index()
    df = df.iloc[:, [0, 1, 2, 3, 8]].copy()
    return df

# 指数をいくつか比較するつもりなので終値だけ指数化したものを作る。(開始:100)
def price_index(df):
    df['pind'] = df['終値'] / df.iloc[0, 3] * 100
    return df

# 標準偏差を作るために前日との比率を作る。
def add_pchg(df):
    df['pchg'] = df['終値'].pct_change()
    return df

# 標準偏差を作る。1か月分(20日)と3ヵ月分(20×3)
def add_std(df):
    df['std20'] = df['pchg'].rolling(20).std() * np.sqrt(365)
    df['std60'] = df['pchg'].rolling(60).std() * np.sqrt(365)
    return df

# 上のモジュールをまとめてデータを作る
def csv_to_data(ind_name, start_year='2000'):
    df = get_csv(ind_name)
    df = df[start_year:]
    df = price_index(df)
    df = add_pchg(df)
    df = add_std(df)
    return df
という感じで価格データを作りました。
グラフのデータは以下のような感じで、まぁ簡単です。
def rel_chart60(df, df2, name, name2):
    fig = plt.figure(figsize=(10,7))
    ax = plt.subplot(2,1,1, title='Price')
    ax2 = plt.subplot(2,1,2, title='STD')

    ax.plot(df['pind'], label='{}'.format(name))
    ax.plot(df2['pind'], label='{}'.format(name2))
    ax.legend()
    ax.grid()

    ax2.plot(df['std60'], label='{}'.format(name))
    ax2.plot(df2['std60'], label='{}'.format(name2))
    ax2.legend()
    ax2.grid()

    plt.show()
で実際にチャートを作る時は以下のような感じです。
df = csv_to_data('tse2')
df2  csv_to_data('tpx')
rel_chart60(df, df2, 'TSE2', 'TOPIX')
という感じでデータを加工して、チャートを作って眺めて感想を述べたという感じです。
今後は、大型株と小型株の動くタイミングが違うので、その辺をどうやってうまく見定めるかなってのを、過去データから見抜けたらなと思います。

