2
2

Delete article

Deleted articles cannot be recovered.

Draft of this article would be also deleted.

Are you sure you want to delete this article?

More than 3 years have passed since last update.

メモリ使用量の確認方法

Posted at

Visual Studioのパフォーマンスプロファイラーで、簡単に(HLAppの)メモリ使用量を確認することができます。

手順

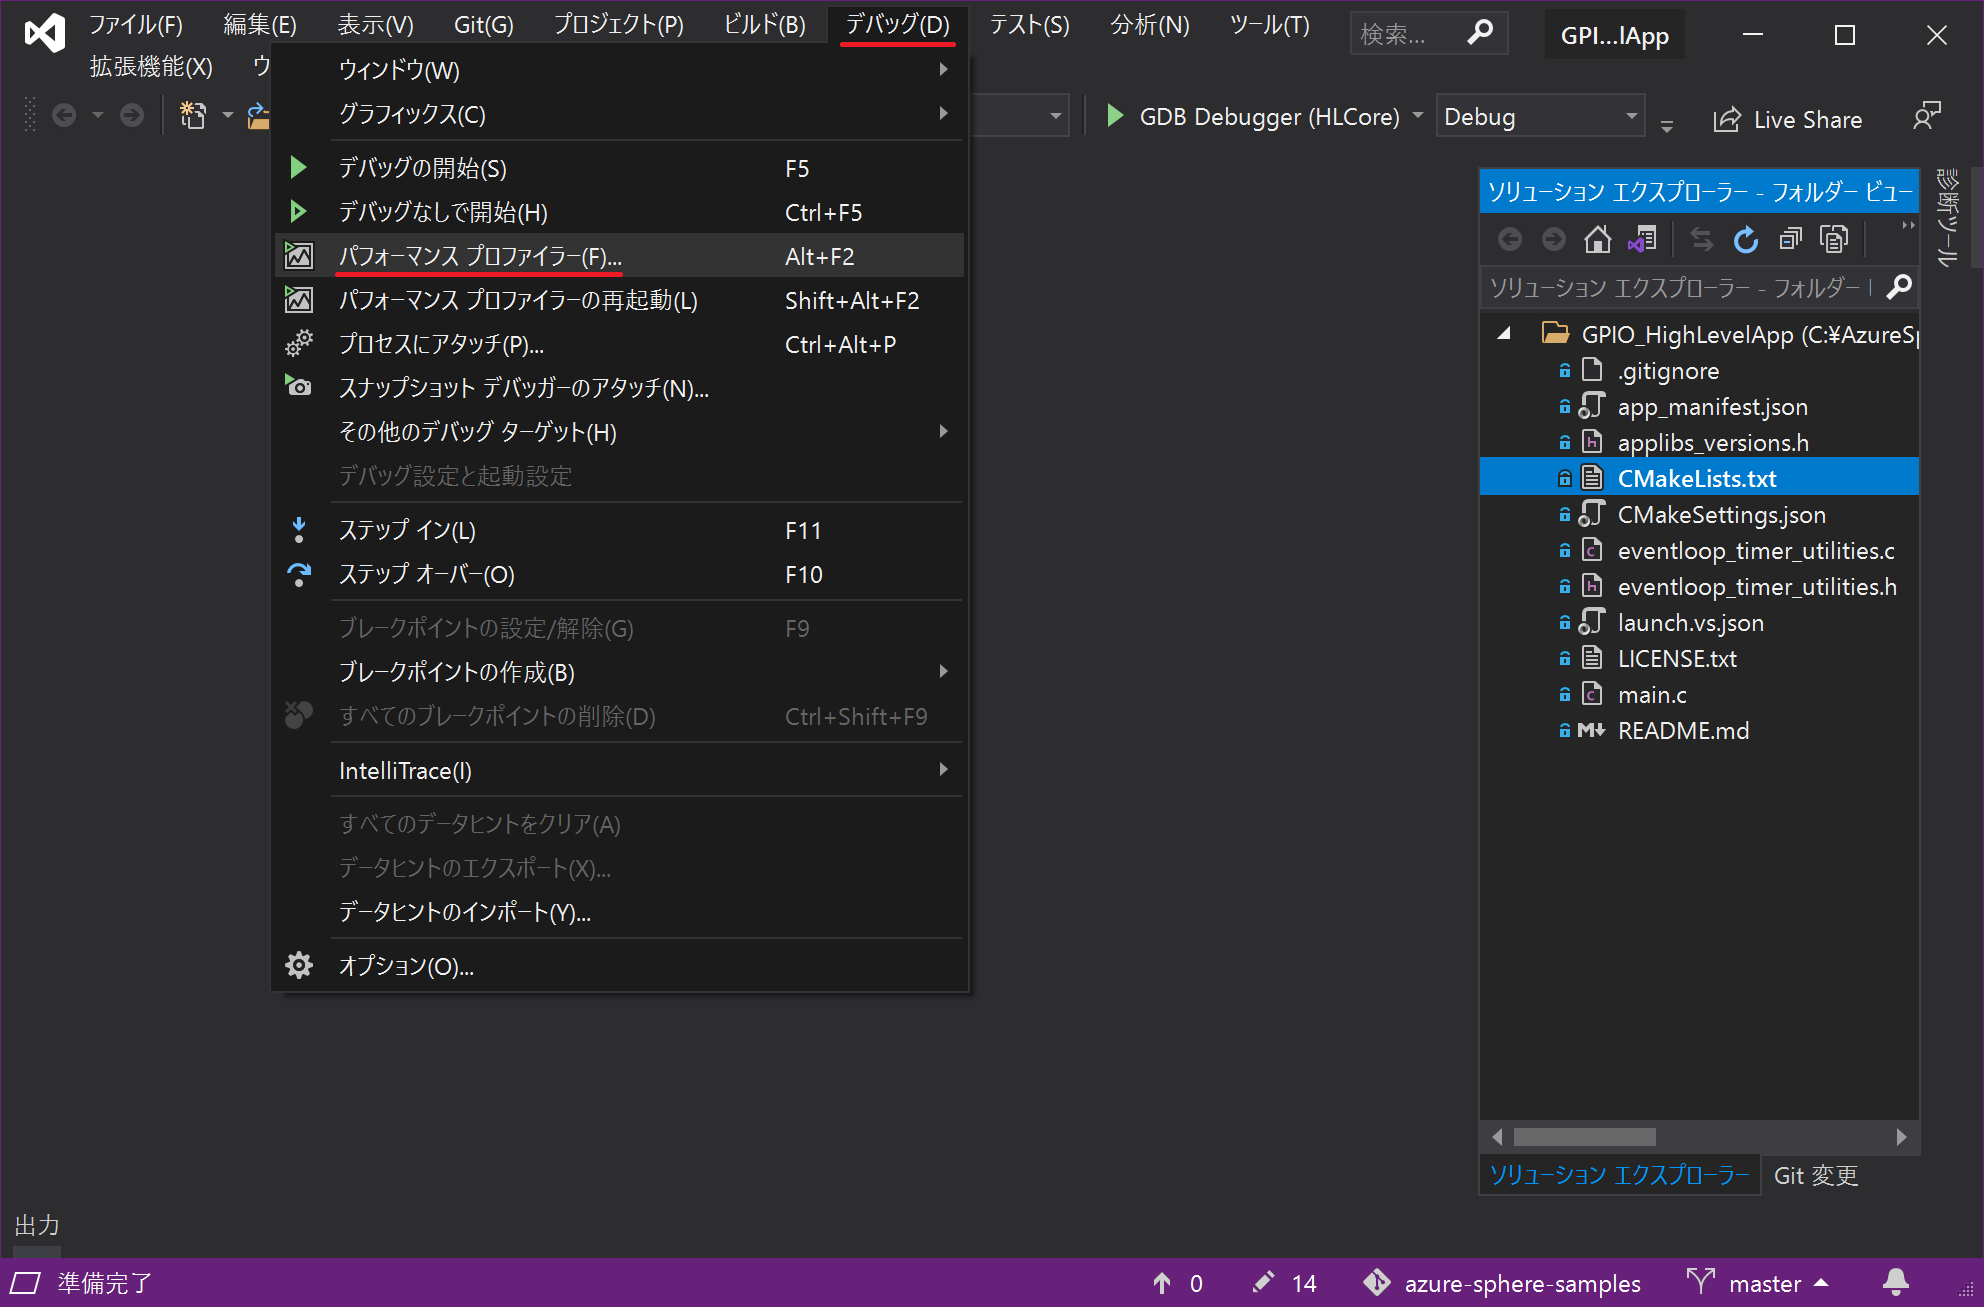
1. パフォーマンスプロファイラーを起動

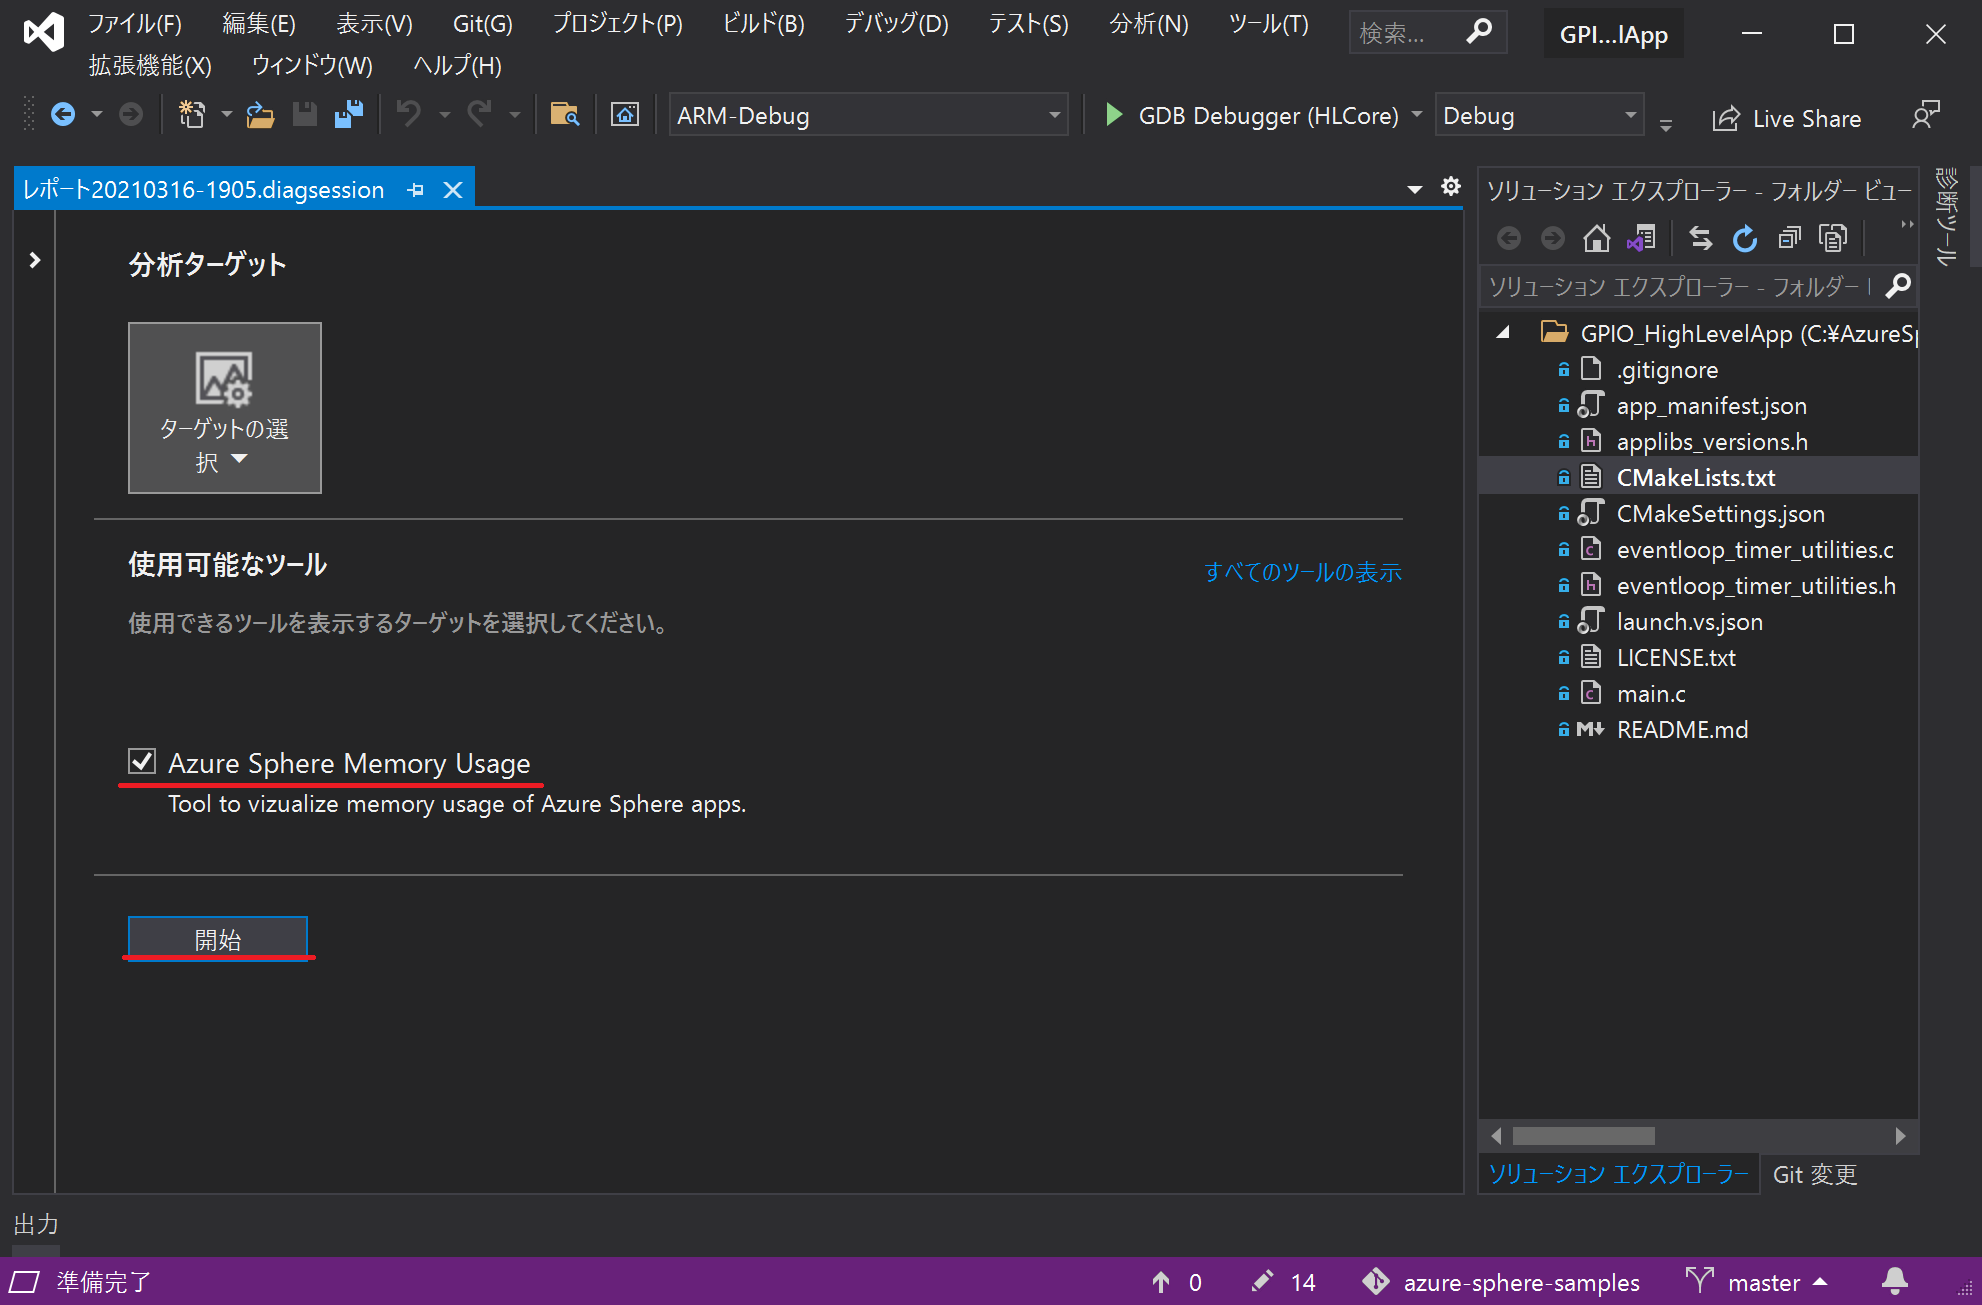
Visual Studioのデバッグ > パフォーマンスプロファイラーを選択して、Azure Sphere Memory Usageをチェックした後、開始ボタンをクリックします。
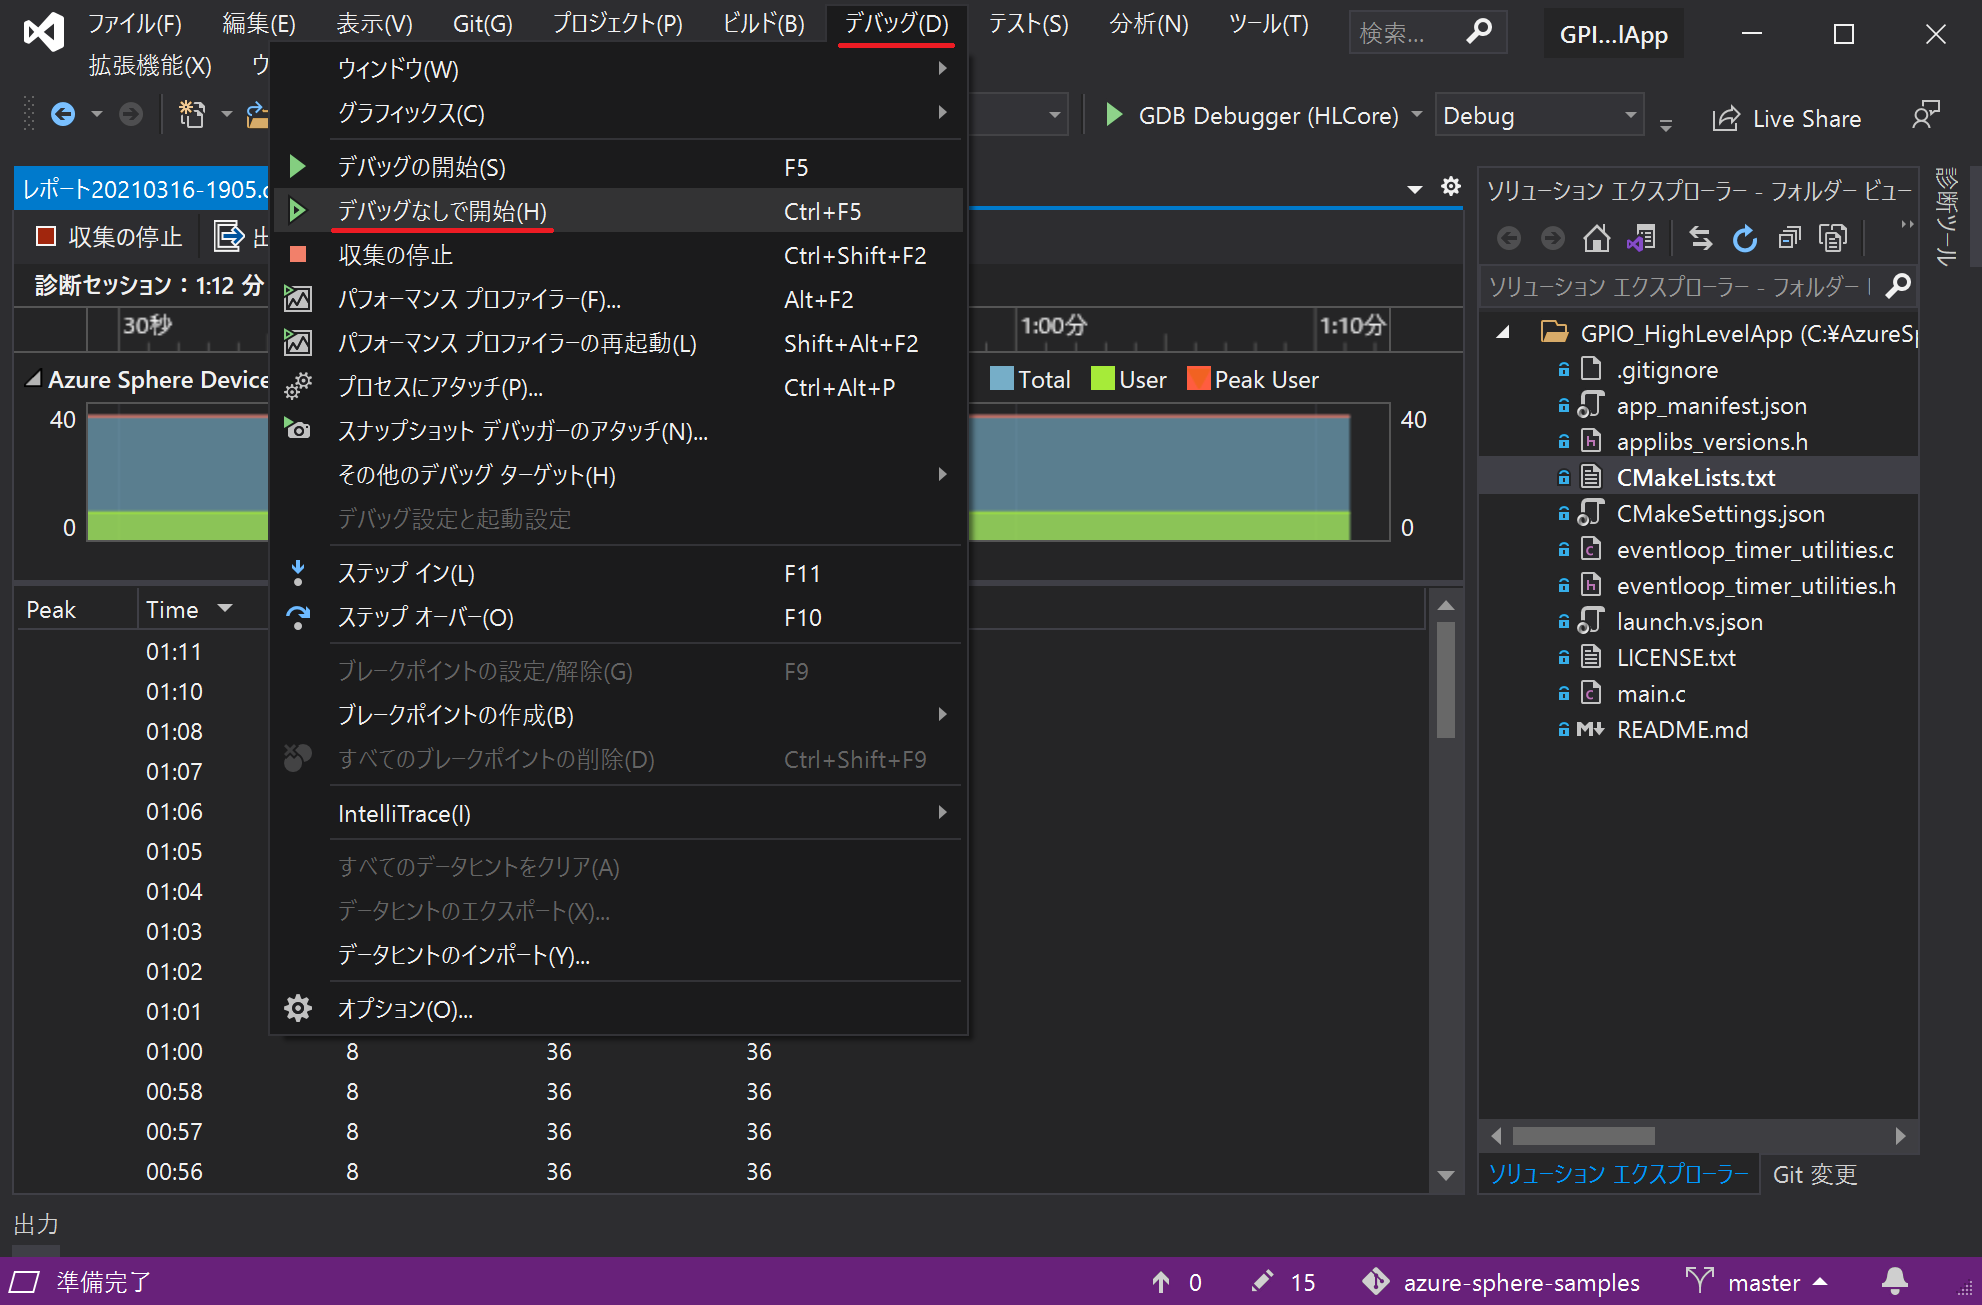
image.png

image.png

image.png

2. アプリをデバッグなしで開始

Visual Studioのデバッグ > デバッグなしで開始を選択します。
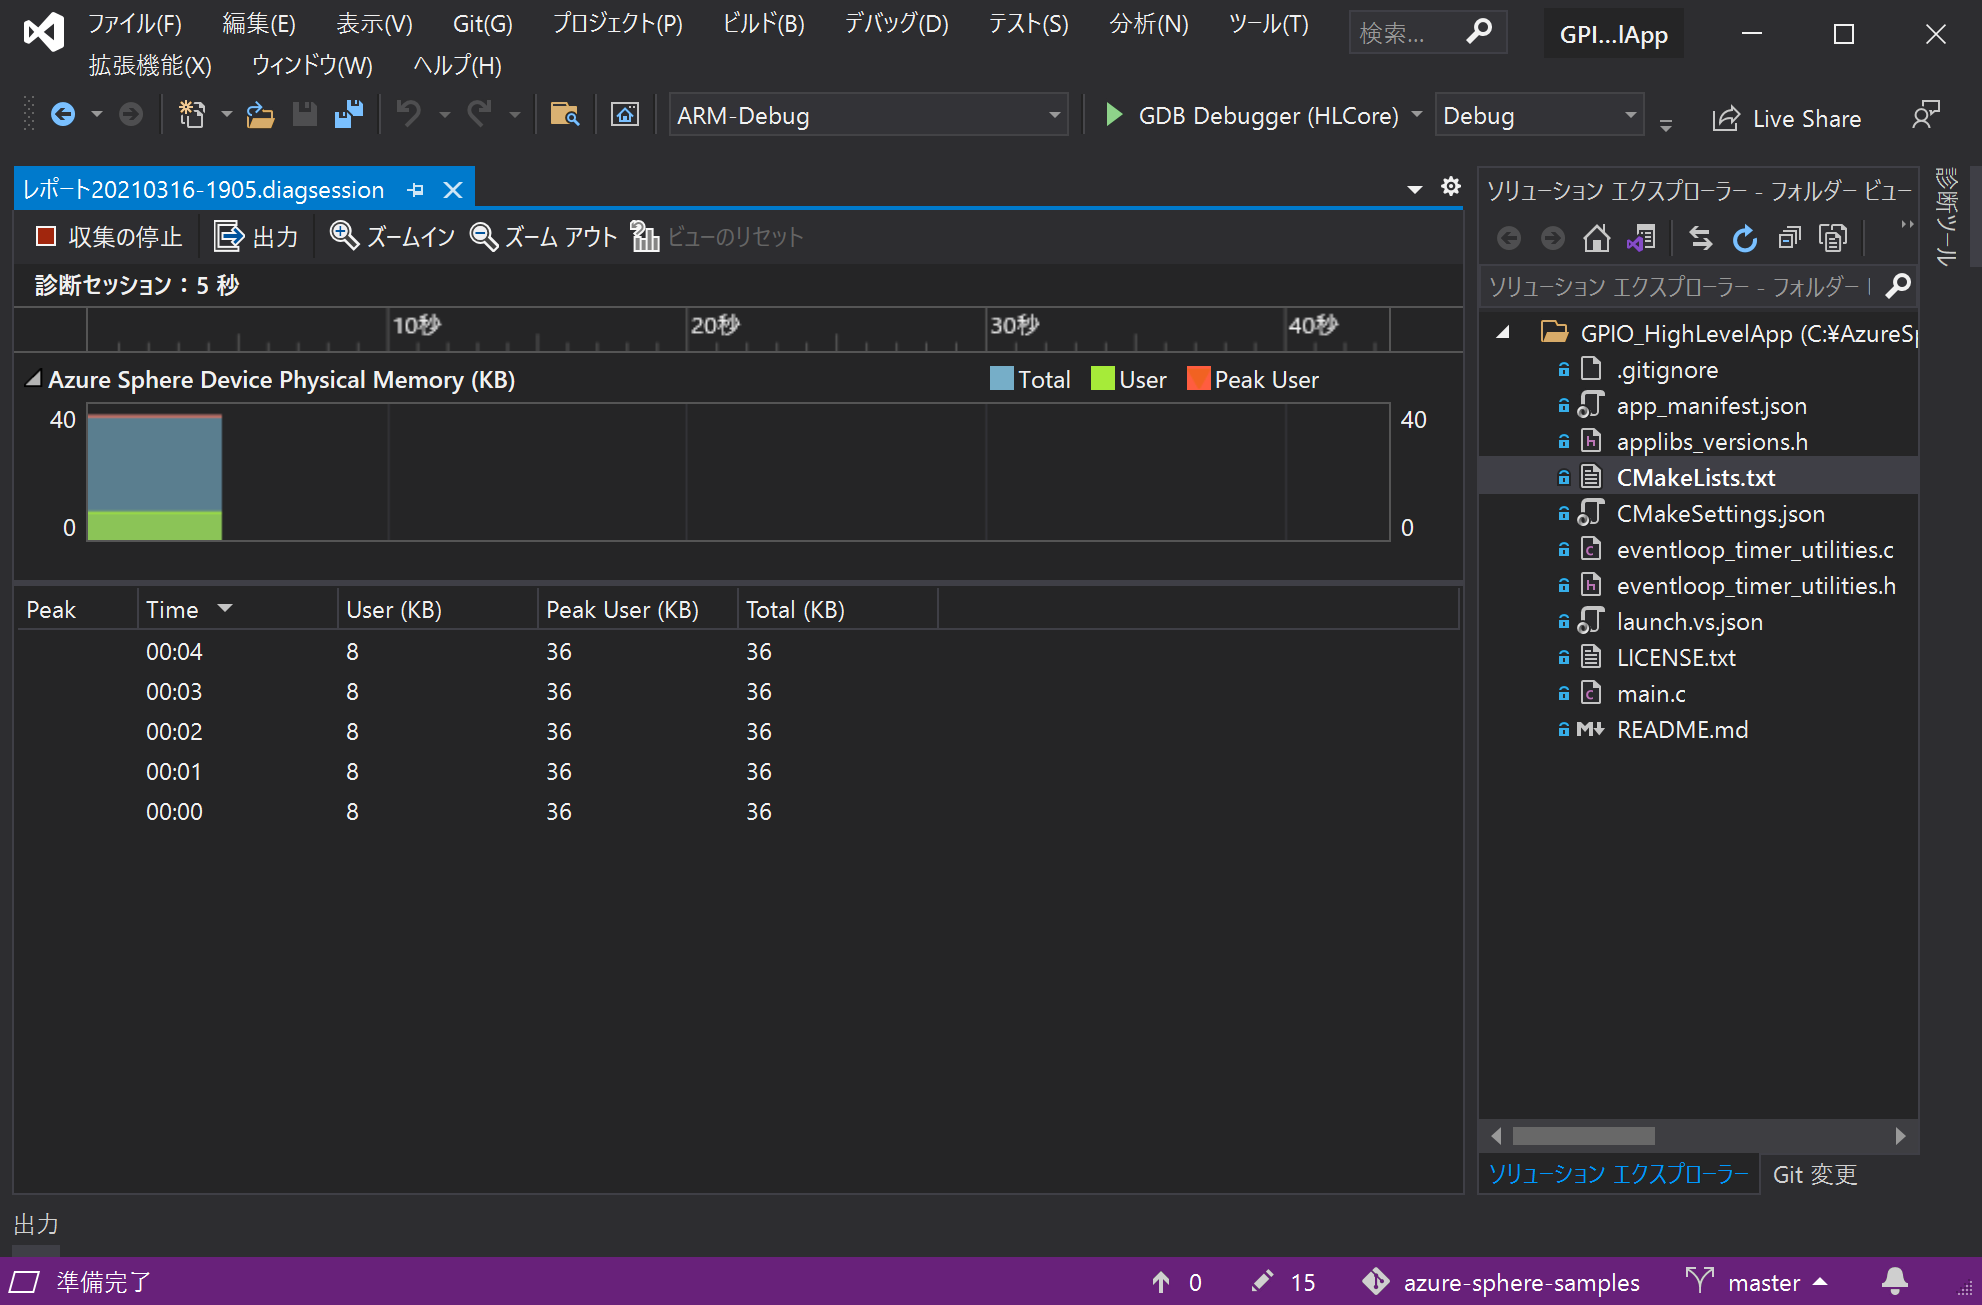
image.png

結果の見方

User列がHLAppのメモリ使用量です。
Peak User列はHLAppのメモリ使用量のピーク値です。
(Total列はOSのメモリ使用が含まれるので参照する必要はありません。)

image.png

補足

デバッグ有りでHLAppを実行(デバッグの開始)した場合は、User/Peak Userにデバッガー(GDB Server)のメモリ使用も加算されるため、参考になりません。

現在のAzure Sphere(MT3620)は、HLAppで使用できるメモリは256KBです。User/Peak Userがこの値以下になるようにしてください。(HLAppが上限以上にメモリを要求すると、SIGKILLが発生します。)

参考

2
2
0

Register as a new user and use Qiita more conveniently

  1. You get articles that match your needs
  2. You can efficiently read back useful information
  3. You can use dark theme
What you can do with signing up
2
2

Delete article

Deleted articles cannot be recovered.

Draft of this article would be also deleted.

Are you sure you want to delete this article?