概要
本記事では,Yahoo!の雨雲レーダー情報をAPIを通して自動取得する方法について解説します.
↓これを数値の状態で取得したい↓

Yahoo!の気象情報APIを使う
Yahoo!ではいくつかのAPIを提供しており,2023年11月現在で
- Yahoo!ショッピングAPI
- Yahoo! Open Local Platform(YOLP)
- テキスト解析Web API
- 求人API
- 深層学習を用いた自然言語処理モデルのAPI
- Yahoo!ニュースでの不適切コメントへの対策に使用されているAI
があります.
今回は「Yahoo! Open Local Platform(YOLP)」の中の「気象情報API」を利用して雨雲レーダーを取得してみます.
簡単な例で試してみる
気象情報APIのドキュメントは以下のページにあります.
こちらを参考にしながら,簡単な例で雨雲レーダーの情報を取得してみましょう.
①リクエストURLを確認する
ドキュメントの冒頭には「リクエストAPI」が記載されています.
このURL末尾に色々なパラメータを付け加え,そのURLにアクセスするとデータが得られる仕組みです.
2023年11月現在では,
- XML
- JSONP
の2つのデータ形式で提供されますが,今回はJSONで取得してみましょう.
いずれにせよ,基本となるURLは以下です.
https://map.yahooapis.jp/weather/V1/place
②URLにパラメータを追加する
上で述べたように,URLの末尾にパラメータを追加していきます.
ドキュメントを参考にして順に設定していきましょう.
appid(必須)
Yahoo!APIを使うには,登録が必要となります.
以下のページに移動してログインし,「新しいアプリケーションを開発」をクリックして必要事項を記入します.
完了したら,アプリケーションの詳細ページに飛べば,Client IDが確認できます.
これがappidです.
※このClient IDは他人に教えないように注意しましょう.
IDを確認できたら,URLに付け加えます.以下のような感じです.
(xxxxxの部分にClient IDが入ります.)
https://map.yahooapis.jp/weather/V1/place?appid=xxxxx
coordinates(必須)
緯度経度を指定するパラメータです.
ドキュメントにある,以下のような指示にしたがいます.
- 経度・緯度の順番で、コンマ区切りで指定してください。
- 世界測地系で指定してください。
- 緯度経度を複数指定する場合は、半角スペースで区切ってください(最大10)。
例えば京都府庁の場合,国土地理院によると
- 経度:135°45′20″
- 緯度:35°01′16″
なので,これを十進度に直した
- 経度:135.755556°
- 緯度:35.021111°
を指定します.つまりリクエストURLは
https://map.yahooapis.jp/weather/V1/place?appid=xxxxx&coordinates=135.755556,35.021111
のようになります.複数指定する場合は半角スペースで区切れ,とのことなので
https://map.yahooapis.jp/weather/V1/place?appid=xxxxx&coordinates=135.755556,35.021111 136.755556,36.021111
という具合になります.
output
出力形式をxmlにするかjsonにするかを指定します.
デフォルトではxmlとなっていますが,今回はJSONで取得したいのでoutput=jsonと指定します.
xmlで取得する場合は何もしなくても良いし,明示的にoutput=xmlと書いても良いです.
https://map.yahooapis.jp/weather/V1/place?appid=xxxxx&coordinates=135.755556,35.021111 136.755556,36.021111&output=json
date
日時をYYYYMMDDHHMIの形式で指定します.
例えば,2023年11月30日9時15分ならdate=202311300915としていします.
ただし,指定できる日時は現在~2時間前までです.
https://map.yahooapis.jp/weather/V1/place?appid=xxxxx&coordinates=135.755556,35.021111 136.755556,36.021111&output=json&date=202311300915
その他
上記以外にも,
- callback
- past
- interval
などのパラメータがありますが,説明は割愛します.
詳しくはドキュメントをお読みください.
③HTTPリクエストを行うコードを書く
今回はPythonで書いてみます.
例えば,requestsというライブラリでリクエストを行えます.
import requests

APPID = 'xxxxxxxxxxxxxxxxxxxxxxxxxxxxxxxxxxxxxxxxxxxxxxxxxxxxxxxx'
POS_LIST = [(135.755556,35.021111), (136.755556,36.021111)]
DATE = '202311300915'

coordinates = ' '.join([f'{lon},{lat}' for lon,lat in POS_LIST])
url = f'https://map.yahooapis.jp/weather/V1/place?appid={APPID}&coordinates={coordinates}&output=json&date={DATE}'

response = requests.get(url)
data = response.json()
※もちろん,APPIDは各自のClient IDに置き換えてください.DATEも,現在~2時間前に書き換える必要があります.
dataはJSON形式(Pythonの型で言うとdict型)で,次のように値が格納されています.
{'ResultInfo': {'Count': 2,
  'Total': 2,
  'Start': 1,
  'Status': 200,
  'Latency': 0.027,
  'Description': ''},
 'Feature': [{'Id': '202311301300_135.755556_35.021111',
   'Name': '地点(135.755556,35.021111)の2023年11月30日 13時00分から60分間の天気情報',
   'Geometry': {'Type': 'point', 'Coordinates': '135.755556,35.021111'},
   'Property': {'WeatherAreaCode': 6110,
    'WeatherList': {'Weather': [{'Type': 'observation',
       'Date': '202311301300',
       'Rainfall': 0.0},
      {'Type': 'observation', 'Date': '202311301310', 'Rainfall': 0.0},
      {'Type': 'observation', 'Date': '202311301320', 'Rainfall': 0.0},
      {'Type': 'forecast', 'Date': '202311301330', 'Rainfall': 0.0},
      {'Type': 'forecast', 'Date': '202311301340', 'Rainfall': 0.0},
      {'Type': 'forecast', 'Date': '202311301350', 'Rainfall': 0.0},
      {'Type': 'forecast', 'Date': '202311301400', 'Rainfall': 0.0}]}}},
  {'Id': '202311301300_136.755556_36.021111',
   'Name': '地点(136.755556,36.021111)の2023年11月30日 13時00分から60分間の天気情報',
   'Geometry': {'Type': 'point', 'Coordinates': '136.755556,36.021111'},
   'Property': {'WeatherAreaCode': 5210,
    'WeatherList': {'Weather': [{'Type': 'observation',
       'Date': '202311301300',
       'Rainfall': 0.0},
      {'Type': 'observation', 'Date': '202311301310', 'Rainfall': 0.0},
      {'Type': 'observation', 'Date': '202311301320', 'Rainfall': 0.25},
      {'Type': 'forecast', 'Date': '202311301330', 'Rainfall': 0.0},
      {'Type': 'forecast', 'Date': '202311301340', 'Rainfall': 0.0},
      {'Type': 'forecast', 'Date': '202311301350', 'Rainfall': 0.0},
      {'Type': 'forecast', 'Date': '202311301400', 'Rainfall': 0.0}]}}}]}
ここから,自分が欲しいデータを取り出していけばいいわけです.
出力データの形式については,ドキュメントの「レスポンスフィールド」の項目を見てもらうとわかります.
例えば,1地点目の13時00分における降水強度(1時間当たり何mmの強さの雨が降った/降るか)の実測値は次のようにしてアクセスできます.
data['Feature'][0]['Property']['WeatherList']['Weather'][0]['Rainfall']
# --> 0.0
指定範囲内の降水強度を取得するプログラムを書く
ここまでで,簡単な例で降水強度を取得する方法について解説しました.
では前節のコードを利用して,ある指定範囲内の降水強度を取得してみましょう.
方針としては,
-
get_json関数:緯度のリスト,経度のリスト,日時を渡すとレスポンス(JSON)を返す -
ext_date関数:レスポンス結果(JSON)を渡すと,降水強度の実測値のみが格納された配列を返す - 上記関数を使って,緯度経度の範囲を指定するとその範囲内の降水強度の値がすべて格納された配列を取得するプログラムを書く
です.今回使用したライブラリは以下です.
import requests
from datetime import datetime
import numpy as np
import pandas as pd
import json
from tqdm import tqdm
get_json関数
緯度のリストlat_list,経度のリストlon_list,日時dateを渡すとJSON(辞書)を返す関数を実装します.
コードは以下のとおりです1.
APPIDはグローバル変数で,Client IDが文字列で格納されています.
def get_json(lat_list:list[int], lon_list:list[int], date:str):
    """
    Retrieves weather data in JSON format from the Yahoo! Weather API based on the given latitude, longitude, and date.

    Args:
        lat_list (list[int]): A list of latitude values.
        lon_list (list[int]): A list of longitude values.
        date (str): The date for which weather data is requested in the format 'YYYYMMDDHHMI'.

    Returns:
        dict: A dictionary containing the weather data in JSON format.

    Example:
        lat_list = [35.6895, 37.7749]
        lon_list = [139.6917, -122.4194]
        date = '202303011200'
        weather_data = get_json(lat_list, lon_list, date)
    """
    # check length of lat_list and lon_list (more than 10 is not allowed)
    if len(lat_list) > 10 or len(lon_list) > 10:
        print(f'**ERROR** Please specify less than 10 coordinates: {len(lat_list)}, {len(lon_list)}')
        exit()

    # check date (more than 2hour ago is not allowed)
    now = datetime.now()
    date_formatted = datetime.strptime(date, '%Y%m%d%H%M')
    if (now - date_formatted).total_seconds() >= 7200:
        print(f'**ERROR** Please specify a date_formattedwithin 2 hours: {date_formatted}')
        exit()

    # create URL
    pos_list = [f'{lon:.6f},{lat:.6f}' for lat,lon in zip(lat_list,lon_list)]
    pos_str = ' '.join(pos_list)
    URL = f'https://map.yahooapis.jp/weather/V1/place?coordinates={pos_str}&appid={APPID}&output=json&date={date}&interval=5&past=0'

    # check length of URL (more than 2048Byte is not allowed)
    if len(URL.encode('utf-8')) > 2048:
        print(f'**ERROR** URL is too long: {len(URL.encode("utf-8"))} Byte')

    # get data
    response = requests.get(URL)
    data = response.json()

    # check response
    if response.status_code != 200:
        print(f'**ERROR** Response Error : {data}\n{URL}')
        exit()

    # check coordinates
    for i in range(data['ResultInfo']['Count']):
        get_coord = data['Feature'][i]['Geometry']['Coordinates']
        org_coord = pos_list[i]
        if get_coord != org_coord:
            print(f'**ERROR** The specified latitude and longitude are invalid: {get_coord}, {org_coord}')
            exit()

    return data
だらだらと書いていますが,実は# check ...という部分のコードはすべて例外処理で,メイン部分だけを取り出すと以下のようになります.
### 例外処理を除いたコード
def get_json(lat_list, lon_list, date):
    # create URL
    pos_list = [f'{lon:.6f},{lat:.6f}' for lat,lon in zip(lat_list,lon_list)]
    pos_str = ' '.join(pos_list)
    URL = f'https://map.yahooapis.jp/weather/V1/place?coordinates={pos_str}&appid={APPID}&output=json&date={date}&interval=5&past=0'

    # get data
    response = requests.get(URL)
    data = response.json()

    return data
ext_data関数
レスポンス結果(辞書)を渡すと,降水強度の実測値のみが格納された配列を返す関数を実装します.
コードは以下のとおりです.
def ext_data(data: dict):
    """
    Extracts rainfall values from the given data dictionary.

    Args:
        data (dict): The data dictionary containing weather information from the Yahoo! Weather API.

    Returns:
        np.ndarray: A two-dimensional array containing the rainfall values. The shape is (len(lat_list), 60//interval).
        list[str]: A list of dates corresponding to the rainfall values.
    """
    values,dates = [],[]
    dates = [time['Date'] for time in data['Feature'][0]['Property']['WeatherList']['Weather'] if time['Type']=='observation']
    for i in range(data['ResultInfo']['Count']):
        weather = data['Feature'][i]['Property']['WeatherList']['Weather']
        value = [time['Rainfall'] for time in weather if time['Type']=='observation']
        values.append(value)
    values = np.array(values)
    return values,dates
返される値はvaluesとdatesで,
-
values:降水強度の実測値が入った2次元配列(ndarray).shapeは(地点数, 時間個数).予報値は省いているので注意. -
dates:取得した時間分の日時情報.- 例:
dates = ["202311300900", "202311300905", "202311300910", ...]
- 例:
という情報が入っています.
main処理
あとはget_jsonとext_dataを用いて指定範囲内のデータを取得するだけです.
if __name__ == '__main__':
    DATE = '202311291100'
    LAT_RANGE = (36.0, 38.0)
    LON_RANGE = (136.5, 139.5)
    GRID_SIZE = 0.01

    # create lat_list and lon_list
    lat_list = np.arange(LAT_RANGE[0], LAT_RANGE[1], GRID_SIZE)
    lon_list = np.arange(LON_RANGE[0], LON_RANGE[1], GRID_SIZE)
    lat_list, lon_list = np.meshgrid(lat_list, lon_list)
    lat_list = lat_list.flatten()
    lon_list = lon_list.flatten()

    # get data
    try:
        for i in tqdm(range(0, len(lat_list), 10)):
            data = get_json(lat_list[i:i+10], lon_list[i:i+10], DATE)
            if i == 0:
                values,dates = ext_data(data)
            else:
                values = np.concatenate([values, ext_data(data)[0]], axis=0)
    except Exception as e:
        print('**Error**:', e)

    # save data to csv
    df = pd.DataFrame({'lat':lat_list, 'lon':lon_list})
    df_values = pd.DataFrame(values, columns=dates)
    df = pd.concat([df, df_values], axis=1)
    df.to_csv('data.csv', index=False)

    print('Success!')
-
DATE:日時をYYYYMMDDHHMI形式で指定. -
LAT_RANGE:緯度の最大最小値をタプルで指定. -
LON_RANGE:経度の最大最小値をタプルで指定. -
GRID_SIZE:グリッドサイズ.- 例えば
LAT_RANGE=(36,36.2),LON_RANGE=(136,136.3),GRID_SIZE=0.1とした場合,緯度方向には36.0,36.1,36.2,経度方向には136.0,136.1,136.2,136.3の間隔でデータが取得できます. -
GRID_SIZEを$1/N$倍にすると$N^2$倍の時間がかかるので注意してください.まあまあ時間かかります.
- 例えば
APIの仕様上,1レスポンスにつき10地点までしか取得できないため,指定した領域内に11地点以上ふくまれる場合は10地点ごとにリクエストを行っています.
もし取得途中に何らかのエラーを吐いた場合は,それまで取得したデータが水の泡となってしまわぬよう,エラー直前までのデータを保存するという処理をしています.
保存データ形式は.csvです.
- 行方向:地点
- 列方向:時間
可視化してみる
きちんと取得できているか,可視化して確認してみましょう.
地図はcartopyを使って描画しました.
色合いは気象庁っぽくなるようにしています.その方法についてはこちらの記事が参考になりました.
import pandas as pd
import numpy as np
import matplotlib.pyplot as plt
from matplotlib.colors import ListedColormap,LinearSegmentedColormap
import cartopy.crs as ccrs
import cartopy.feature as cfeature

df = pd.read_csv('data.csv')

jmacolors=np.array(
   [
    [242,242,242,1],#white
    [160,210,255,1],
    [33 ,140,255,1],
    [0  ,65 ,255,1],
    [250,245,0,1],
    [255,153,0,1],
    [255,40,0,1],
    [180,0,104,1]],dtype=np.float64
)
jmacolors[:,:3] /=256
levels = [0,1,5,10,20,30,50,80]

ax = plt.axes(projection=ccrs.PlateCarree())
ax.set_extent([df.lon.min(), df.lon.max(), df.lat.min(), df.lat.max()], ccrs.Geodetic())
ax.add_feature(cfeature.COASTLINE)
gl = ax.gridlines(draw_labels=True)
gl.right_labels = False
contour = ax.contourf(
    df['lon'].unique(), df['lat'].unique(), df['202311291100'].values.reshape(df.lon.unique().shape[0],df.lat.unique().shape[0]).T,
    transform=ccrs.PlateCarree(),
    colors=jmacolors, levels=levels, extend='max')
plt.colorbar(contour)
plt.show()
結果がこちらです.
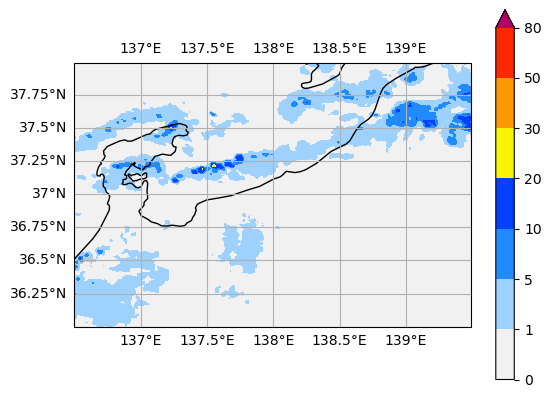
ちなみに同じ時刻の気象庁がコレです2.
ちゃんと一致してそうですね.

ソースコード
本記事で使用したコードはGitHubに上げています.
今回のフォルダは03-YOLPです.