概要
普段私たちは天気予報を頼りに、予定や服装を決めたりしますが
「1週間先の天気予報って実際当たってるの?」
「予報コロコロ変わってない?」
と、私はふと疑問に思いました。
しかし、過去の予報履歴なるものは通常公開されません。
このため、予報がどれくらい当たっているかを確認するのが難しいです。
そこで僕は、Google Apps Script(GAS)を利用して、気象庁の天気予報を定期的に取得して保存するプログラムを組み、天気予報の移り変わりをモニタリングすることを考えました。
本記事はその方法を解説します。
大まかな流れ
- 気象庁の天気予報をJSONで取得する(GAS)
- 取得したJSON内の情報をスプレッドシートに書き込む(GAS)
- スプレッドシートから値を取得し、モニタリング結果を可視化する(Python)
① GASプロジェクトの作成
自分のGoogle driveの任意の場所を開いて、左タブの「新規」をクリック。

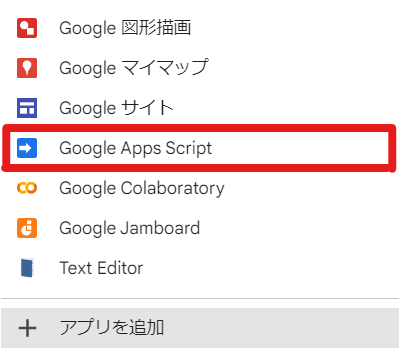
「その他」にカーソルを合わせて…

「Google Apps Script」をクリック。プロジェクトが新規作成されます。
下のような画面が出てきます。ここにGASのコードを書いていく形になります。

② 天気予報をJSONで取得するコードを書く
以下のようなURLにリクエストを投げると、天気予報の情報が入ったJSONが返ってきます。
https://www.jma.go.jp/bosai/forecast/data/forecast/エリアコード.json
エリアコードは、例えばこちらのサイトを参考にしてみてください。
京都府の場合は「260000」がエリアコードです。
エリアコード一覧をJSONで取得する方法もあります。
詳しい手順は【ここ】をクリック
-
気象庁の「https://www.jma.go.jp/bosai/forecast/」にアクセス
-
F12キーを押してデベロッパーツールを開く
-
上のタブから「Console」を選択

-
コンソールに
Forecast.Const.WEEK_AREASと打ち込み、Enterキー

-
エリアコード一覧が表示されるので、右クリックしてCopy objectを選択し、コピー

-
ローカルでテキストファイルを新規作成し、貼り付け

-
拡張子を「.json」にして保存し、GASプロジェクトを作成したディレクトリ(Google drive)にアップロード
GASでリクエストを送るコードは以下の通りです。説明はコメントアウトで書きました。
// JSONを取得+保存するだけのコード
function getJSON() {
  var now = new Date();  // 取得日時(JSONのファイル名に使う)
  var date = Utilities.formatDate(now, "GMT+9", "yyyyMMddHHmmss");  // ファイル名用にフォーマットを整える
  var weather_all = {};  // 全地域の予報データを格納する辞書

  // 全地域のエリアコード
  var areaCodeList = ["011000","012000","016000","013000","014100","015000","017000","020000","050000","030000","040000","060000","070000","080000","090000","100000","110000","120000","130000","140000","200000","190000","220000","230000","210000","240000","150000","160000","170000","180000","250000","260000","270000","280000","290000","300000","330000","340000","320000","310000","360000","370000","380000","390000","350000","400000","440000","420000","410000","430000","450000","460100","471000","472000","473000","474000"];
  // 各地域ごとにJSONを取得するループ
  for (var j=0; j<areaCodeList.length; j++) {
    // リクエスト先URL
    const weatherUrl = 'https://www.jma.go.jp/bosai/forecast/data/forecast/' + areaCodeList[j] + '.json';
    // リクエスト送信してレスポンスを受け取る
    var weatherj = UrlFetchApp.fetch(weatherUrl);
    // JSONをパース
    var weather = JSON.parse(weatherj);
    // さっき定義したweather_allに格納
    weather_all[areaCodeList[j]] = weather;
  }

  // ----- weather_allをJSONとして保存(任意) ------
  var folderId = "xxxxxxxxxxxxxxxxxxxxxx";  // 保存先のフォルダID
  var weatherString = JSON.stringify(weather_all);
  var fileName = date + ".json";
  var folder = DriveApp.getFolderById(folderId);
  var file = folder.createFile(fileName, weatherString);
  Logger.log("JSON file created and saved: " + file.getUrl());
}
フォルダIDとは?
Google driveの任意のフォルダを開き、URLを見てみると下のような形式になっていると思います。
https://drive.google.com/drive/u/0/folders/xxxxxxxxxxxxxxxxxxxxxx
このURLのxxxxxxxxxxxxxxxxxxxxxxに相当する部分がフォルダIDです。
試しに実行してみましょう。
GASを実行するには、上の方にある「実行」をクリックするか「Ctrl+R」を押します。
すると、保存先に{yyyyMMddHHmmss}.jsonというフォーマットの名前でJSONファイルができていると思います。この中に天気予報データが入っています。
※ 保存はしなくても③以降に支障はありません。保存したくない人はコメントアウトしておいてください。
③ JSONファイルの中身をスプレッドシートに書き込む
②ではJSONを取得するコードを書きましたが、これを解析しやすい形でスプレッドシートに書き込む処理を行っていきます。
GASからスプレッドシートを操作するには1つだけ準備が必要です。
GASプロジェクトを開き、左タブにある「サービス」の「+」マークをクリックします。

サービス一覧の中から「Google Sheets API」を選択肢「追加」をクリックします。
これで準備完了です。

データを書き込む用のスプレッドシートは先に作っておいてください。
そのうえで、以下のコードをGASで実行してみてください。
// JSONを取得+スプシに書き込むコード
function writeJSON() {
  // スプレッドシートとの接続
  const SHEET_ID = "xxxxxxxxxxxxxxxxxxxxxx";  // スプレッドシートID
  const SHEET_NAME = "シート1";  // シート名
  var spreadSheet = SpreadsheetApp.openById(SHEET_ID);
  var sheet = spreadSheet.getSheetByName(SHEET_NAME);

  var areaCodeList = ["011000","012000","016000","013000","014100","015000","017000","020000","050000","030000","040000","060000","070000","080000","090000","100000","110000","120000","130000","140000","200000","190000","220000","230000","210000","240000","150000","160000","170000","180000","250000","260000","270000","280000","290000","300000","330000","340000","320000","310000","360000","370000","380000","390000","350000","400000","440000","420000","410000","430000","450000","460100","471000","472000","473000","474000"];
  for (var j=0; j<areaCodeList.length; j++) {
    // JSONを取得(getJSON()と同様)
    console.log(areaCodeList[j]);
    const weatherUrl = 'https://www.jma.go.jp/bosai/forecast/data/forecast/' + areaCodeList[j] + '.json';
    var weatherj = UrlFetchApp.fetch(weatherUrl);
    var weather = JSON.parse(weatherj);

    // JSON解析
    var sub = weather[1]['timeSeries'];  // 週間予報のみを取り出す
    var reportDatetime = weather[1]['reportDatetime'];  // 予報更新日時
    var dates = sub[0]['timeDefines'];  // 予報対象日時

    var df = [];
    for (var i=0; i<dates.length; i++) {
      var line = [];
      line.push(reportDatetime);  // 予報更新日時
      line.push(areaCodeList[j]);  // エリアコード
      line.push(dates[i]);  // 予報対象日時
      line.push(sub[0]['areas'][0]['weatherCodes'][i]);  // 天気コード
      line.push(sub[0]['areas'][0]['pops'][i]);  // 降水確率
      line.push(sub[0]['areas'][0]['reliabilities'][i]);  // 予報の信頼度
      line.push(sub[1]['areas'][0]['tempsMin'][i]);  // 最低気温
      line.push(sub[1]['areas'][0]['tempsMinUpper'][i]);  // 最低気温の信頼上限
      line.push(sub[1]['areas'][0]['tempsMinLower'][i]);  // 最低気温の信頼下限
      line.push(sub[1]['areas'][0]['tempsMax'][i]);  // 最高気温
      line.push(sub[1]['areas'][0]['tempsMaxUpper'][i]);  // 最高気温の信頼上限
      line.push(sub[1]['areas'][0]['tempsMaxLower'][i]);  // 最高気温の信頼下限
      df.push(line);
    }
    sheet.getRange(sheet.getLastRow()+1, 1, df.length, line.length).setValues(df);  // スプシへ書き込み
    Utilities.sleep(100);  // 100ミリ秒待機
  }
}
スプレッドシートIDとは?
作成したスプレッドシートを開き、URLを見てみると下のような形式になっていると思います。
https://docs.google.com/spreadsheets/d/xxxxxxxxxxxxxxxxxxxxxx/edit#gid=0
このURLのxxxxxxxxxxxxxxxxxxxxxxに相当する部分がスプレッドシートIDです。
実行してみると、取得した天気予報がスプレッドシートに書き込まれていると思います。

左から
- 予報更新日時(毎日11時と17時に更新されるようです)
- エリアコード
- 予報対象日
- 天気コード(晴れ・曇り・雨・晴れ時々曇りなどを表すコード)
- 降水確率
- 予報の信頼度(A・B・C)
- 最低気温
- 最低気温の信頼上限
- 最低気温の信頼下限
- 最高気温
- 最高気温の信頼上限
- 最高気温の信頼下限
を表しています。
④ GAS定期実行の設定をする
気象庁の天気予報は(週間予報の場合)毎日11時と17時の2回更新されますが、逐一手動で実行するわけにもいきません。
そこで、定期実行の設定を行います。
GASプロジェクトを開き、左端の時計マークをクリックします。

すると「トリガー」の設定画面になるので、左下の「トリガーを追加」をクリックします。
下のような画面が出てくるので、下記画像のように設定してください。

ここで設定したのは「毎日17時~18時の間のどこかでwriteJSONを実行してください」ということです。
同様に「午後5時~6時」の部分を「午前11時~12時」に変えたトリガーを作成してください。
これで定期実行の設定が完了です。
⑤ Pythonでスプレッドシートを読み込み、予報の推移をモニタリングする
データがたまってきたら、結果を可視化します。
結果の可視化にはPythonを使用し、今回はColaboratoryで実行します。
最終的なイメージは下記画像のような感じです。

上には天気アイコンが表示され、2023年9月16日の京都府の予報がどう移り変わっているかが分かります。その下には「予報の信頼度」「降水確率」「最低気温」「最高気温」が折れ線グラフで表示されます。塗りつぶしている部分は信頼区間を表します。
これをPythonで実装していきます。使用するライブラリは以下のとおりです。
from google.colab import auth
import gspread
from google.auth import default

import os
import json
import numpy as np
import pandas as pd
import matplotlib.pyplot as plt
from IPython.display import HTML
5-1. スプレッドシートから値を取得する
Pythonでスプレッドシートと連携する方法(認証する方法)はいくつかあるのですが、今回はそのうちの1つを紹介します。
次のコードを実行すると取得できます。
「認証」の部分でポップアップが出てきますが、全部「承認する」でOKです。
# 認証
auth.authenticate_user()
creds, _ = default()
gc = gspread.authorize(creds)

# データを取得
spreadsheet_id = 'xxxxxxxxxxxxxxxxxxxxxx'
worksheet_name = 'シート1'
url = f'https://docs.google.com/spreadsheets/d/{spreadsheet_id}/'
ss = gc.open_by_url(url)
st = ss.worksheet(worksheet_name)
data = st.get_all_values()
上記の方法だと、ノートブックを開くごとに認証の許可をもとめられてやや面倒です。
認証を省略したい人はこちらの記事を参考にしてみてください。
【もう迷わない】Pythonでスプレッドシートに読み書きする初期設定まとめ
https://tanuhack.com/operate-spreadsheet/
これでdataにスプレッドシートの値が格納されます。
5-2.お天気アイコンを表示する
お天気アイコンは以下のようなURLから取得することができます。画像形式はSVGです。
https://www.jma.go.jp/bosai/forecast/img/天気コード.svg
天気コードは、スプレッドシートの列名で言うと「weatherCode」に相当します。
これに対応するURLにアクセスして画像をとってくればいいわけです。
しかし、そう簡単にはいきません。天気コード「203」の画像を見ようとすると…
「404 Not Found」が返ってきます。実は、天気コードと画像ファイル名はビミョーに合致していないのです…。
なので天気コードとファイル名の対応表を取得する必要があります。
その手順を以下に示します。
-
気象庁の「https://www.jma.go.jp/bosai/forecast/」にアクセス
-
F12キーを押してデベロッパーツールを開く
-
上のタブから「Console」を選択
-
コンソールに
Forecast.Const.TELOPSと打ち込み、Enterキー

-
weatherCode一覧が表示されるので、これをコピー(Copy objectをクリック)

-
ローカルでテキストファイルを新規作成し、貼り付け

-
拡張子を
.jsonに変更して保存し(weatherCode.json)、Google driveにアップロード
このJSONを参照すれば、天気コードと画像の対応関係がわかります。
これでお天気アイコンを表示する準備は整いました。Pythonコードを書きましょう。
# カレントディレクトリ(必要に応じて変更)
PATH = './'

# スプレッドシートから取得したデータをpd.DataFrameに変換
df = pd.DataFrame(data[1:], columns=data[0])
df = df.replace('', np.nan)
df = df.astype({'pop':'float','tempMin':'float','tempMinUpper':'float','tempMinLower':'float','tempMax':'float','tempMaxUpper':'float','tempMaxLower':'float'})

# 天気コードと画像の対応表(JSON)を読み込む
with open(PATH + '/weatherCode.json', 'r') as f:
    weatherCode_dict = json.load(f)

# areaCodeと地域名の対応表(JSON)を読み込む(→手順②を参照)
with open(PATH + '/areaCode.json', 'r') as f:
    areaCode_dict = json.load(f)

def get_weather_icon(weatherCode):
    """weatherCode入力すると、天気アイコンを表示するタグを返す関数"""
    img_url = f'https://www.jma.go.jp/bosai/forecast/img/{weatherCode_dict[str(weatherCode)][0]}'
    img = f'<img src="{img_url}">'
    return img

# -----------------------------------------
targetDate = '2023-09-16'
area = 'Kyoto Prefecture'  # areaCodeで予報地域を指定する場合はこの行は無視してareaCodeに直接代入
areaCode = areaCode_dict[area]

sub = df[df['targetDate']+df['areaCode'] == targetDate+'T00:00:00+09:00'+areaCode]

# 予報対象日時
display(HTML(f'<h2>{targetDate}の{area}の予報の変化</h2>'))

# 予報発表日時
date_html = ''
for date in sub['reportDatetime'].values:
    date_html += '<span style="font-size: 11px;">' + date[:10] + '(' + date[11:13] + '時)' + '\t→\t' + '</span>'
display(HTML(date_html))

# 天気アイコン
icon = ''
for weatherCode in sub['weatherCode'].values:
    if weatherCode is not np.nan:
        icon += get_weather_icon(weatherCode)
icon = '<style>.image-container {display: flex; gap: 37px;}</style><div class="image-container">' + icon + '</div>'
display(HTML(icon))
可視化はHTMLを用いました。HTMLを文字列型として書いて、それをHTML()にツッコめば表示してくれます。
5-3. 信頼度・降水確率・最低/最高気温のグラフを表示する
単純にmatplotlibでプロットするだけです。
デザインはご自分の好みで調整してください。
# 信頼度
plt.figure(figsize=(15,2))
plt.subplot(1,4,1)
plt.plot(pd.to_datetime(sub['reportDatetime']), sub['reliability'].map({'A':3,'B':2,'C':1}), color='orange', marker='o')
plt.xticks(pd.to_datetime(sub['reportDatetime']), rotation=90)
plt.yticks(ticks=[1,2,3], labels=['C','B','A'])
plt.ylim(0.9,3.1)
plt.title('Reliability')
plt.grid()

# 降水確率
plt.subplot(1,4,2)
plt.plot(pd.to_datetime(sub['reportDatetime']), sub['pop'], color='blue', marker='o')
plt.xticks(pd.to_datetime(sub['reportDatetime']), rotation=90)
plt.ylim(0,100)
plt.title('The Chance of Precipitation')
plt.grid()

# 最低気温
plt.subplot(1,4,3)
plt.plot(pd.to_datetime(sub['reportDatetime']), sub['tempMin'], color='blue', marker='o')
plt.fill_between(pd.to_datetime(sub['reportDatetime']), sub['tempMinLower'], sub['tempMinUpper'], alpha=0.1, color='blue')
plt.xticks(pd.to_datetime(sub['reportDatetime']), rotation=90)
plt.title('Minimum Temperature')
plt.grid()

# 最高気温
plt.subplot(1,4,4)
plt.plot(pd.to_datetime(sub['reportDatetime']), sub['tempMax'], color='red', marker='o')
plt.fill_between(pd.to_datetime(sub['reportDatetime']), sub['tempMaxLower'], sub['tempMaxUpper'], alpha=0.1, color='red')
plt.xticks(pd.to_datetime(sub['reportDatetime']), rotation=90)
plt.title('Maximum Temperature')
plt.grid()

plt.show()
⑥ 完成!
できましたー!
予想最高/最低気温の推移を見てみると面白いですね。
日が経つにつれて信頼区間(?)がだんだん狭まっていることが見てとれます。
全体のコード
全体のコードも載せておきます(コメントアウトなし)。
トグルをクリックすると開きます。
GAS
function getJSON() {
  var now = new Date();
  var date = Utilities.formatDate(now, "GMT+9", "yyyyMMddHHmmss");
  var weather_all = {};
  var areaCodeList = ["011000","012000","016000","013000","014100","015000","017000","020000","050000","030000","040000","060000","070000","080000","090000","100000","110000","120000","130000","140000","200000","190000","220000","230000","210000","240000","150000","160000","170000","180000","250000","260000","270000","280000","290000","300000","330000","340000","320000","310000","360000","370000","380000","390000","350000","400000","440000","420000","410000","430000","450000","460100","471000","472000","473000","474000"];

  for (var j=0; j<areaCodeList.length; j++) {
    console.log(areaCodeList[j]);
    const weatherUrl = 'https://www.jma.go.jp/bosai/forecast/data/forecast/' + areaCodeList[j] + '.json';
    var weatherj = UrlFetchApp.fetch(weatherUrl);
    var weather = JSON.parse(weatherj);
    weather_all[areaCodeList[j]] = weather;
  }

  var folderId = 'xxxxxxxxxxxxxxxxxxxxxx';
  var weatherString = JSON.stringify(weather_all);
  var fileName = date + '.json';
  var folder = DriveApp.getFolderById(folderId);
  var file = folder.createFile(fileName, weatherString);
  Logger.log('JSON file created and saved: ' + file.getUrl());
}

function writeJSON() {
  const SHEET_ID = "xxxxxxxxxxxxxxxxxxxxxx";
  const SHEET_NAME = "シート1";
  var spreadSheet = SpreadsheetApp.openById(SHEET_ID);
  var sheet = spreadSheet.getSheetByName(SHEET_NAME);

  var areaCodeList = ["011000","012000","016000","013000","014100","015000","017000","020000","050000","030000","040000","060000","070000","080000","090000","100000","110000","120000","130000","140000","200000","190000","220000","230000","210000","240000","150000","160000","170000","180000","250000","260000","270000","280000","290000","300000","330000","340000","320000","310000","360000","370000","380000","390000","350000","400000","440000","420000","410000","430000","450000","460100","471000","472000","473000","474000"];

  for (var j=0; j<areaCodeList.length; j++) {
    console.log(areaCodeList[j]);
    const weatherUrl = 'https://www.jma.go.jp/bosai/forecast/data/forecast/' + areaCodeList[j] + '.json';
    var weatherj = UrlFetchApp.fetch(weatherUrl);
    var weather = JSON.parse(weatherj);

    var sub = weather[1]['timeSeries'];
    var reportDatetime = weather[1]['reportDatetime'];
    var dates = sub[0]['timeDefines'];
    console.log(reportDatetime);

    var df = [];
    for (var i=0; i<dates.length; i++) {
      var line = [];
      line.push(reportDatetime);
      line.push(areaCodeList[j]);
      line.push(dates[i]);
      line.push(sub[0]['areas'][0]['weatherCodes'][i]);
      line.push(sub[0]['areas'][0]['pops'][i]);
      line.push(sub[0]['areas'][0]['reliabilities'][i]);
      line.push(sub[1]['areas'][0]['tempsMin'][i]);
      line.push(sub[1]['areas'][0]['tempsMinUpper'][i]);
      line.push(sub[1]['areas'][0]['tempsMinLower'][i]);
      line.push(sub[1]['areas'][0]['tempsMax'][i]);
      line.push(sub[1]['areas'][0]['tempsMaxUpper'][i]);
      line.push(sub[1]['areas'][0]['tempsMaxLower'][i]);
      df.push(line);
    }
    sheet.getRange(sheet.getLastRow()+1, 1, df.length, line.length).setValues(df);
    Utilities.sleep(100);
  }
}
Python
from google.colab import auth
import gspread
from google.auth import default

import os
import json
import numpy as np
import pandas as pd
import matplotlib.pyplot as plt
from IPython.display import HTML

auth.authenticate_user()
creds, _ = default()
gc = gspread.authorize(creds)

spreadsheet_id = 'xxxxxxxxxxxxxxxxxxxxxx'
worksheet_name = 'シート1'
url = f'https://docs.google.com/spreadsheets/d/{spreadsheet_id}/'
ss = gc.open_by_url(url)
st = ss.worksheet(worksheet_name)
data = st.get_all_values()

PATH = './'

df = pd.DataFrame(data[1:], columns=data[0])
df = df.replace('', np.nan)
df = df.astype({'pop':'float','tempMin':'float','tempMinUpper':'float','tempMinLower':'float','tempMax':'float','tempMaxUpper':'float','tempMaxLower':'float'})

with open(PATH + '/weatherCode.json', 'r') as f:
    weatherCode_dict = json.load(f)

with open(PATH + '/areaCode.json', 'r') as f:
    areaCode_dict = json.load(f)

def get_weather_icon(weatherCode):
    img_url = f'https://www.jma.go.jp/bosai/forecast/img/{weatherCode_dict[str(weatherCode)][0]}'
    img = f'<img src="{img_url}">'
    return img

targetDate = '2023-09-16'
area = 'Kyoto Prefecture'
areaCode = areaCode_dict[area]

sub = df[df['targetDate']+df['areaCode'] == targetDate+'T00:00:00+09:00'+areaCode]

display(HTML(f'<h2>{targetDate}の{area}の予報の変化</h2>'))

date_html = ''
for date in sub['reportDatetime'].values:
    date_html += '<span style="font-size: 11px;">' + date[:10] + '(' + date[11:13] + '時)' + '\t→\t' + '</span>'
display(HTML(date_html))

icon = ''
for weatherCode in sub['weatherCode'].values:
    if weatherCode is not np.nan:
        icon += get_weather_icon(weatherCode)
icon = '<style>.image-container {display: flex; gap: 37px;}</style><div class="image-container">' + icon + '</div>'
display(HTML(icon))

plt.figure(figsize=(15,2))
plt.subplot(1,4,1)
plt.plot(pd.to_datetime(sub['reportDatetime']), sub['reliability'].map({'A':3,'B':2,'C':1}), color='orange', marker='o')
plt.xticks(pd.to_datetime(sub['reportDatetime']), rotation=90)
plt.yticks(ticks=[1,2,3], labels=['C','B','A'])
plt.ylim(0.9,3.1)
plt.title('Reliability')
plt.grid()

plt.subplot(1,4,2)
plt.plot(pd.to_datetime(sub['reportDatetime']), sub['pop'], color='blue', marker='o')
plt.xticks(pd.to_datetime(sub['reportDatetime']), rotation=90)
plt.ylim(0,100)
plt.title('The Chance of Precipitation')
plt.grid()

plt.subplot(1,4,3)
plt.plot(pd.to_datetime(sub['reportDatetime']), sub['tempMin'], color='blue', marker='o')
plt.fill_between(pd.to_datetime(sub['reportDatetime']), sub['tempMinLower'], sub['tempMinUpper'], alpha=0.1, color='blue')
plt.xticks(pd.to_datetime(sub['reportDatetime']), rotation=90)
plt.title('Minimum Temperature')
plt.grid()

plt.subplot(1,4,4)
plt.plot(pd.to_datetime(sub['reportDatetime']), sub['tempMax'], color='red', marker='o')
plt.fill_between(pd.to_datetime(sub['reportDatetime']), sub['tempMaxLower'], sub['tempMaxUpper'], alpha=0.1, color='red')
plt.xticks(pd.to_datetime(sub['reportDatetime']), rotation=90)
plt.title('Maximum Temperature')
plt.grid()

plt.show()
参考サイト
- 「Pythonと気象庁の天気予報JSONを使って全国の天気予報を取得してみる」
- 「気象庁JSONファイルにあるweatherCode一覧」
- 【もう迷わない】Pythonでスプレッドシートに読み書きする初期設定まとめ