生存時間解析といえば、Kaplan-Meier とか Cox比例ハザードモデル が有名ですね。それらの理論や、テストデータを用いた解析実例などはインターネット上の様々な場所で説明が見られます。それらは大変勉強になりますが、今いちピンと来ない部分があったので、人工データを使った実験を行ってみました。
lifelinesパッケージのインストール
Python では次のようにして、生存時間解析を行うlifelinesパッケージのインストールができます。
!pip install lifelines
Collecting lifelines
  Downloading lifelines-0.26.3-py3-none-any.whl (348 kB)
[K     |████████████████████████████████| 348 kB 4.1 MB/s
[?25hRequirement already satisfied: autograd>=1.3 in /usr/local/lib/python3.7/dist-packages (from lifelines) (1.3)
Requirement already satisfied: scipy>=1.2.0 in /usr/local/lib/python3.7/dist-packages (from lifelines) (1.4.1)
Collecting formulaic<0.3,>=0.2.2
  Downloading formulaic-0.2.4-py3-none-any.whl (55 kB)
[K     |████████████████████████████████| 55 kB 4.0 MB/s
[?25hCollecting autograd-gamma>=0.3
  Downloading autograd-gamma-0.5.0.tar.gz (4.0 kB)
Requirement already satisfied: pandas>=0.23.0 in /usr/local/lib/python3.7/dist-packages (from lifelines) (1.1.5)
Requirement already satisfied: matplotlib>=3.0 in /usr/local/lib/python3.7/dist-packages (from lifelines) (3.2.2)
Requirement already satisfied: numpy>=1.14.0 in /usr/local/lib/python3.7/dist-packages (from lifelines) (1.19.5)
Requirement already satisfied: future>=0.15.2 in /usr/local/lib/python3.7/dist-packages (from autograd>=1.3->lifelines) (0.16.0)
Collecting interface-meta>=1.2
  Downloading interface_meta-1.2.4-py2.py3-none-any.whl (14 kB)
Requirement already satisfied: wrapt in /usr/local/lib/python3.7/dist-packages (from formulaic<0.3,>=0.2.2->lifelines) (1.12.1)
Requirement already satisfied: astor in /usr/local/lib/python3.7/dist-packages (from formulaic<0.3,>=0.2.2->lifelines) (0.8.1)
Requirement already satisfied: cycler>=0.10 in /usr/local/lib/python3.7/dist-packages (from matplotlib>=3.0->lifelines) (0.10.0)
Requirement already satisfied: python-dateutil>=2.1 in /usr/local/lib/python3.7/dist-packages (from matplotlib>=3.0->lifelines) (2.8.2)
Requirement already satisfied: kiwisolver>=1.0.1 in /usr/local/lib/python3.7/dist-packages (from matplotlib>=3.0->lifelines) (1.3.2)
Requirement already satisfied: pyparsing!=2.0.4,!=2.1.2,!=2.1.6,>=2.0.1 in /usr/local/lib/python3.7/dist-packages (from matplotlib>=3.0->lifelines) (2.4.7)
Requirement already satisfied: six in /usr/local/lib/python3.7/dist-packages (from cycler>=0.10->matplotlib>=3.0->lifelines) (1.15.0)
Requirement already satisfied: pytz>=2017.2 in /usr/local/lib/python3.7/dist-packages (from pandas>=0.23.0->lifelines) (2018.9)
Building wheels for collected packages: autograd-gamma
  Building wheel for autograd-gamma (setup.py) ... [?25l[?25hdone
  Created wheel for autograd-gamma: filename=autograd_gamma-0.5.0-py3-none-any.whl size=4049 sha256=cdfec914daf278a4ce9515aa47adb1700592a8026837a6a428275825812fa37b
  Stored in directory: /root/.cache/pip/wheels/9f/01/ee/1331593abb5725ff7d8c1333aee93a50a1c29d6ddda9665c9f
Successfully built autograd-gamma
Installing collected packages: interface-meta, formulaic, autograd-gamma, lifelines
Successfully installed autograd-gamma-0.5.0 formulaic-0.2.4 interface-meta-1.2.4 lifelines-0.26.3
生存曲線のモデルを作成
今回は、生存曲線のモデルとして
$ S(t) = e^{-(w_1 x_1 + w_2 x_2 + b) t} $ (式1)
という式を用います。ここで $S(t)$ は、時刻 $t$ において生き残っている者の割合です。 $x = [x_1, x_2]$ と $w = [w_1, w_2]$ はそれぞれ、各個人が持つ性質と、それが生存に及ぼす影響です。 $b$ は適当なバイアス項です。
式1の逆関数を求めると
$ t = - ln S(t) / (w_1 x_1 + w_2 x_2 + b)$ (式2)
となります。これらを Python で書き下すと、
import numpy as np

class SurvivalProbability:
    def __init__(self, w):
        self.w = np.array(w)
        self.b = 2

    def __call__(self, t, x): # 式1
        f = (self.w * x).sum() + self.b
        return np.exp(-f * t)

    def reverse(self, y, x): # 式2(逆関数)
        f = (self.w * x).sum() + self.b
        return -np.log(y) / f
この式に、 テキトーな $w$ を代入して、それを今回用いる生存曲線とします。
w = np.array([4, -1])
survival = SurvivalProbability(w)
$x$ の値を色々変えて、生存曲線を描いてみましょう。
import matplotlib.pyplot as plt

t_series = np.linspace(0, 2, 11)

plt.plot(t_series, survival(t_series, [0, 0]), label="x = [0, 0]", marker="o")
plt.plot(t_series, survival(t_series, [1, 0]), label="x = [1, 0]", marker="<")
plt.plot(t_series, survival(t_series, [0, 1]), label="x = [0, 1]", marker=">")
plt.xlabel("Time")
plt.ylabel("Survival rate")
plt.legend()
plt.xticks(t_series)
plt.yticks([x / 10 for x in range(0, 11)])
plt.grid()
plt.show()
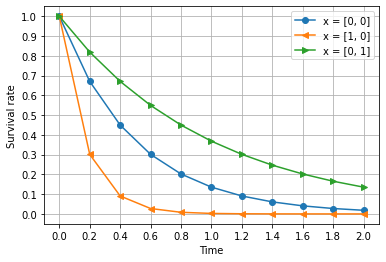
$ x = [0, 0]$ のとき、生存時間の中央値は約 0.35 付近であることが分かります。
また、$x_1 = 1$ になると生存時間の中央値が半分ほどになり、$x_2 = 1$ になると生存時間の中央値が2倍近くになること、などが分かります。
生存曲線モデルに基づいた実験データ作成
以上の生存曲線モデルに基づいて、実験用データを作成しましょう。生存曲線の逆関数を用いて、生存率 $S(t)$ を一定間隔でサンプリングすれば、擬似的な実験データが得られます。
# 生存率から一定間隔でサンプリング
y_series = np.linspace(0.01, 1, 100)  # 今回は100人分のデータを生成する

# 死亡時刻を得る
d_series = survival.reverse(y_series, [0, 0]) # 今回は x = [0, 0] とする。

plt.plot(y_series, d_series, label="0000", marker="o")
plt.ylabel("Time of death")
plt.xlabel("Individuals")
plt.yticks(t_series)
plt.xticks([x / 10 for x in range(0, 11)])
plt.grid()
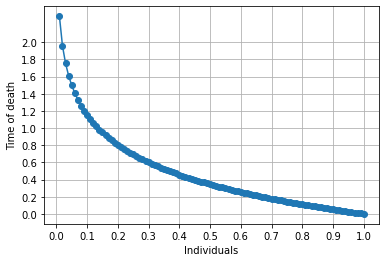
上図は、生存曲線の縦横をひっくり返した図と同じですが、解釈としては、横軸が「それぞれの個人をあらわすID」縦軸が「死亡時刻」という意味になります。以上のようにして得られた変数 d_series は、死亡時刻が入ったデータになります。
KaplanMeierFitter
ここまで準備して、ようやくlifelinesパッケージの登場です。まずは KaplanMeierFitterを用いて、生存曲線を予測します。そして理論曲線と比較します。
from lifelines import KaplanMeierFitter

# Kaplan Meier 法による生存曲線の推定と描画
kmf = KaplanMeierFitter()
kmf.fit(d_series)
kmf.survival_function_.plot()

# 理論曲線
plt.plot(t_series, survival(t_series, [0, 0]), label="x = [0, 0]", marker="o")
plt.xlabel("Time")
plt.ylabel("Survival rate")
plt.legend()
plt.xticks(t_series)
plt.yticks([x / 10 for x in range(0, 11)])
plt.grid()
plt.xlim([0, 2.1])
plt.show()
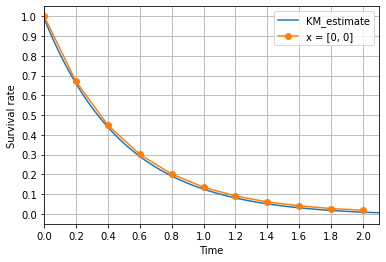
完全に一致したように見えますね。今度は、サンプリング数を減らしてみましょう。
from lifelines import KaplanMeierFitter

# 生存率から一定間隔でサンプリング
y_series = np.linspace(0.01, 1, 10)  # 今回は10人分のデータを生成する

# 死亡時刻を得る
d_series = survival.reverse(y_series, [0, 0]) # 今回は x = [0, 0] とする。

# Kaplan Meier 法による生存曲線の推定と描画
kmf = KaplanMeierFitter()
kmf.fit(d_series)
kmf.survival_function_.plot()

# 理論曲線
plt.plot(t_series, survival(t_series, [0, 0]), label="x = [0, 0]", marker="o")
plt.xlabel("Time")
plt.ylabel("Survival rate")
plt.legend()
plt.xticks(t_series)
plt.yticks([x / 10 for x in range(0, 11)])
plt.xlim([0, 2.1])
plt.grid()
plt.show()
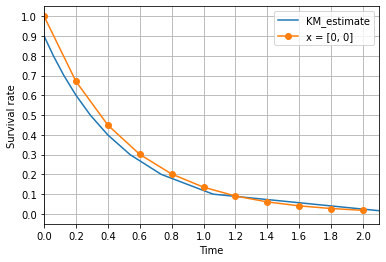
なるほど、ここまでサンプル数が少ないと理論曲線からいくらかズレてきます。
Cox回帰分析
以上のKaplanMeierFitterでは共変数は使いませんでしたが、今度は共変数を使ったCox回帰分析をしてみましょう。
まずは人工データの作成です。
import pandas as pd

y_series = np.linspace(0.01, 1, 100) # # 今回は10人分のデータを生成する

data = []
for i, y in enumerate(y_series):
    if (i%3) == 0:
        x = [0, 0]
    elif (i%3) == 1:
        x = [1, 0]
    else:
        x = [0, 1]

    dat = survival.reverse(y, x) # 死亡時刻を得る
    data.append([dat, x[0], x[1]])

df = pd.DataFrame(data)
df.columns = ["Time", "x1", "x2"]
df
| Time | x1 | x2 | |
|---|---|---|---|
| 0 | 2.302585 | 0 | 0 |
| 1 | 0.652004 | 1 | 0 |
| 2 | 3.506558 | 0 | 1 |
| 3 | 1.609438 | 0 | 0 |
| 4 | 0.499289 | 1 | 0 |
| ... | ... | ... | ... |
| 95 | 0.040822 | 0 | 1 |
| 96 | 0.015230 | 0 | 0 |
| 97 | 0.003367 | 1 | 0 |
| 98 | 0.010050 | 0 | 1 |
| 99 | -0.000000 | 0 | 0 |
100 rows × 3 columns
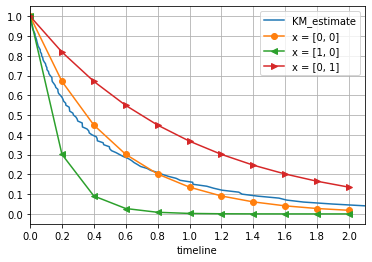
比較のため、再びKaplanMeierFitterを使ってみます。先程は理論曲線とほぼ一致しましたが、今回は共変数も動かしているため、理論曲線と一致しません。
from lifelines import KaplanMeierFitter

kmf = KaplanMeierFitter()
kmf.fit(df["Time"])
kmf.survival_function_.plot()
plt.plot(t_series, survival(t_series, [0, 0]), label="x = [0, 0]", marker="o")
plt.plot(t_series, survival(t_series, [1, 0]), label="x = [1, 0]", marker="<")
plt.plot(t_series, survival(t_series, [0, 1]), label="x = [0, 1]", marker=">")
plt.xticks(t_series)
plt.yticks([x / 10 for x in range(0, 11)])
plt.xlim([0, 2.1])
plt.grid()
plt.legend()
plt.show()
さて、いよいよCox回帰を行うCoxPHFitterの登場です。次のようにしてfittingを行います。
from lifelines import CoxPHFitter

cph = CoxPHFitter()
cph.fit(df, duration_col='Time')
<lifelines.CoxPHFitter: fitted with 100 total observations, 0 right-censored observations>
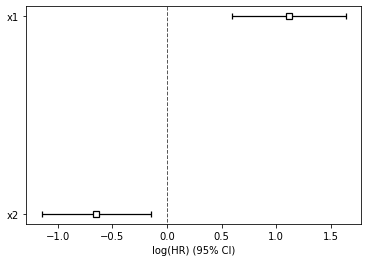
次のようにして結果のサマリーが得られます。 coef というのが共変数の重要度に相当します。
cph.print_summary()
| model | lifelines.CoxPHFitter |
|---|---|
| duration col | 'Time' |
| baseline estimation | breslow |
| number of observations | 100 |
| number of events observed | 100 |
| partial log-likelihood | -345.81 |
| time fit was run | 2021-10-11 05:42:39 UTC |
| coef | exp(coef) | se(coef) | coef lower 95% | coef upper 95% | exp(coef) lower 95% | exp(coef) upper 95% | z | p | -log2(p) | |
|---|---|---|---|---|---|---|---|---|---|---|
| x1 | 1.12 | 3.05 | 0.27 | 0.59 | 1.64 | 1.81 | 5.16 | 4.17 | <0.005 | 15.01 |
| x2 | -0.65 | 0.52 | 0.26 | -1.15 | -0.14 | 0.32 | 0.87 | -2.52 | 0.01 | 6.42 |
| Concordance | 0.67 |
|---|---|
| Partial AIC | 695.63 |
| log-likelihood ratio test | 35.85 on 2 df |
| -log2(p) of ll-ratio test | 25.86 |
今回、人工的に与えた $w = [4, -1]$ と、正負は一致しますが値は一致しませんね。この意味を理解するには理論をもうちょっと深掘りする必要がありそうです。
cph.plot()
<matplotlib.axes._subplots.AxesSubplot at 0x7fcb6468f510>
生存曲線の予測
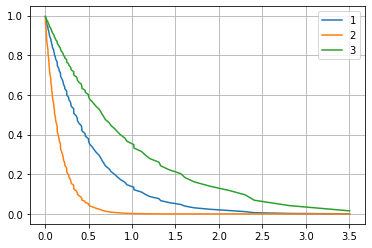
今回は、各個人は全員既に死亡したものとしてそのデータをフィッティングしましたが、各個人(と同じ共変数を持つ個人)に対する生存曲線を予測する機能もあるようです。
result = cph.predict_survival_function(df)
plt.plot(result.iloc[:, 0].index, result.iloc[:, 0], label=1)
plt.plot(result.iloc[:, 1].index, result.iloc[:, 1], label=2)
plt.plot(result.iloc[:, 2].index, result.iloc[:, 2], label=3)
plt.legend()
plt.grid()
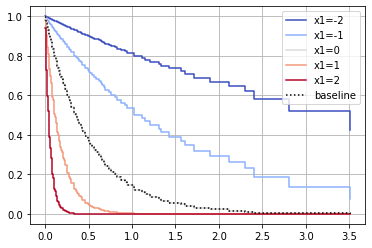
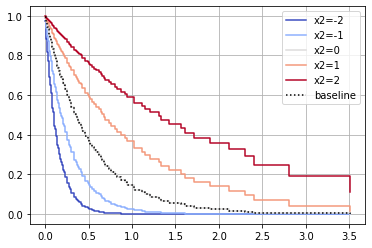
また、次のように、共変数を変化させたときに生存曲線がどのように変化するか予測する機能もあるようです。元データには存在しなかった範囲に外挿することもできるようですね。精度がどうなのかは分かりませんが。
cph.fit(df, duration_col='Time')
cph.plot_partial_effects_on_outcome(covariates='x1', values=[-2, -1, 0, 1, 2], cmap='coolwarm')
plt.grid()
cph.fit(df, duration_col='Time')
cph.plot_partial_effects_on_outcome(covariates='x2', values=[-2, -1, 0, 1, 2], cmap='coolwarm')
plt.grid()
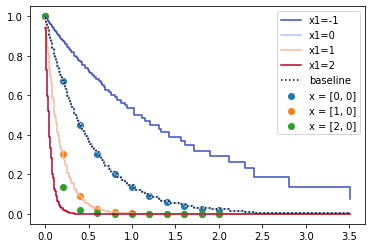
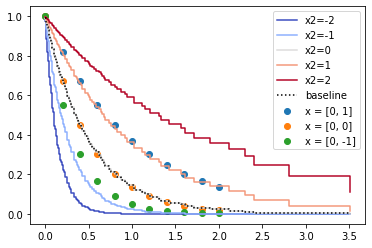
気になったので外挿性について少し実験してみました。予想通り、元データの範囲内においてはけっこう正しいようですが、範囲外に外挿するときはけっこう外れるようですね。
cph.plot_partial_effects_on_outcome(covariates='x1', values=[-1, 0, 1, 2], cmap='coolwarm')
plt.scatter(t_series, survival(t_series, [0, 0]), label="x = [0, 0]", marker="o")
plt.scatter(t_series, survival(t_series, [1, 0]), label="x = [1, 0]", marker="o")
plt.scatter(t_series, survival(t_series, [2, 0]), label="x = [2, 0]", marker="o")
plt.legend()
<matplotlib.legend.Legend at 0x7fcb621fd410>
cph.plot_partial_effects_on_outcome(covariates='x2', values=[-2, -1, 0, 1, 2], cmap='coolwarm')
plt.scatter(t_series, survival(t_series, [0, 1]), label="x = [0, 1]", marker="o")
plt.scatter(t_series, survival(t_series, [0, 0]), label="x = [0, 0]", marker="o")
plt.scatter(t_series, survival(t_series, [0, -1]), label="x = [0, -1]", marker="o")
plt.legend()
<matplotlib.legend.Legend at 0x7fcb621c2dd0>
追記:生存者の影響
以上の解析は、被験者が全員死亡済みのデータでした。現実の生存時間解析では、まだ生存している被験者もデータに登場します。その時刻においてまだ生存しているということは、死亡予定時刻はそれよりもいくらか未来にあるということです。そのようなデータを人工的に作ってみます。
import random
import pandas as pd

def generate_data(r1, r2):
    data = []
    for i in range(len(d_series)):
        if random.random() > r1:
            data.append([d_series[i] * r2, False])
        else:
            data.append([d_series[i], True])

    data = pd.DataFrame(data)
    data.columns =  ["time", "event"]
    return data
関数 generate_data の説明をします。
-
まず、
SurvivalProbabilityによって理論的に計算された死亡時刻のリストをd_seriesとします。このリストにおいては、被験者は全員死亡しています。 -
次に、
r1の確率で「死者」を選び、timeは死亡時刻として動かさず、eventは「死亡イベントが発生した」としてTrueにします。 -
一方、
1 - r1の確率で、その人は「生存者」とし、timeは死亡時刻にr2(0 < r2 < 1) をかけた値(つまり死亡時刻よりも過去の時刻)とし、eventは「まだ死亡していない」としてFalseにします。
以上のようにして、全員が死者であるデータから、生存者を含むデータに作り替えました。
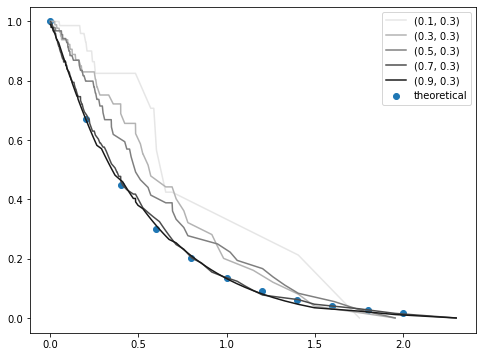
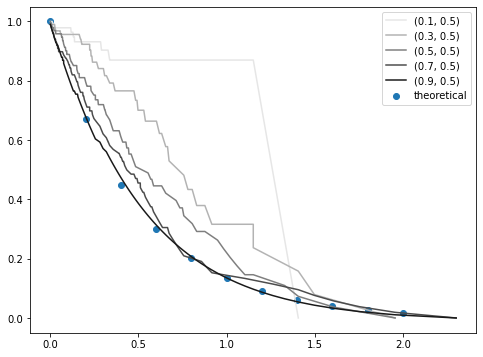
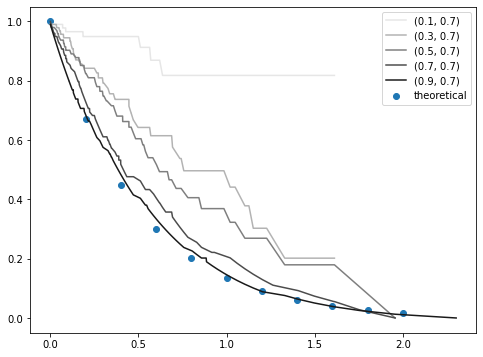
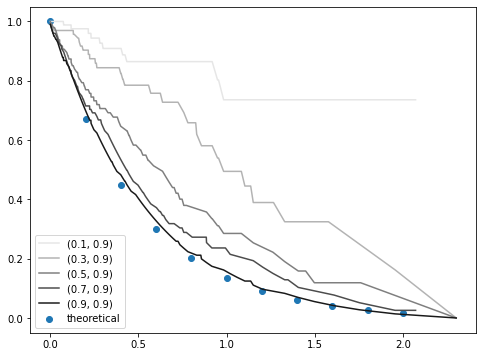
このとき用いた2つの変数、 r1 と r2 の値を動かした時に、KaplanMeierFitter で予測された生存曲線がどのように変化するかをみてみましょう。
from matplotlib import pyplot as plt
from lifelines import KaplanMeierFitter

cmap = plt.get_cmap("binary")
for r2 in range(1, 11, 2):
    plt.figure(figsize=(8, 6))
    r2 = r2 / 10

    for r1 in range(1, 11, 2):
        r1 = r1 / 10
        data = generate_data(r1, r2)
        kmf = KaplanMeierFitter()
        kmf.fit(data['time'], event_observed=data['event'])
        plt.plot(kmf.survival_function_.index, kmf.survival_function_.values, label="({}, {})".format(r1, r2), c=cmap(r1))

    plt.scatter(t_series, survival(t_series, [0, 0]), label="theoretical", marker="o")
    plt.legend()
    plt.show()
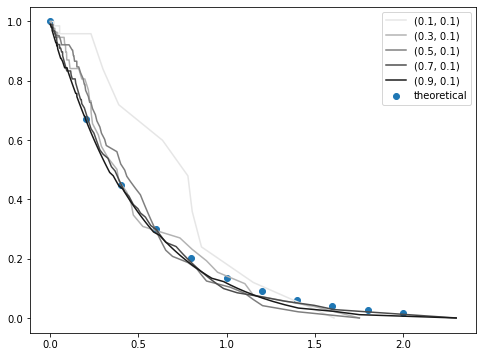
まず、 r2 = 0.1 のとき、すなわち、生存者が、理論的に予測される死亡時刻(寿命?)の 0.1 倍の時刻にて生存報告をしていた場合です。死ぬ直前とかではなく、死ぬよりもだいぶ前に生存報告をしているということです。
r1 が大きいうちはKaplanMeier曲線は理論値とほぼ一致しますが、r1 を大きく減らすと、すなわち生存者の割合を大きく増やすと、KaplanMeier曲線が理論値からずれていくことが分かります。
次に、 r2 = 0.3 のとき、すなわち、生存者が、理論的に予測される死亡時刻(寿命?)の 0.3 倍の時刻にて生存報告をしていた場合です。
r1 が大きいうちはKaplanMeier曲線は理論値とほぼ一致しますが、r1 を減らしたとき、すなわち生存者の割合を増やしたときのズレが大きくなります。
さらに、 r2 = 0.5 のとき、すなわち、生存者が、理論的に予測される死亡時刻(寿命?)の 0.5 倍の時刻にて生存報告をしていた場合です。
r1 が大きいうちはKaplanMeier曲線は理論値とほぼ一致しますが、r1 を減らしたときのズレがもっと大きくなりました。
同様に、 r2 = 0.7 のとき、すなわち、生存者が、理論的に予測される死亡時刻(寿命?)の 0.7 倍の時刻にて生存報告をしていた場合、
r2 = 0.9 のとき、すなわち、生存者が、理論的に予測される死亡時刻(寿命?)の 0.9 倍の時刻にて生存報告をしていた場合、
という感じです。死ぬ直前に生存報告をしていると、だいぶズレてくるんですね。
まとめると、
- 生存曲線は死亡者だけでも作れる。時刻は「死亡時刻」であり、「その時刻までに死んでいる」という意味ではない。
- 生存者を混ぜても良いが、生存者の割合が増えたり、生存者が死ぬ直前に生存報告をしたりすると、理論値からのズレが大きくなる。
といったところでしょうか。
今回の記事はここでおしまいです。気になることがあったら皆様も色々実験してみてください。
