Pythonのmatplotlibは大変便利なのでいつもお世話になっています。とても足を向けて寝られませんが、今日は「点」の大きさについてちょっと試してみたいと思います。
%matplotlib inline
import matplotlib.pyplot as plt
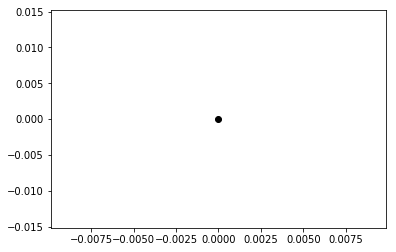
点を描く
plt.scatter(0, 0, c='k')
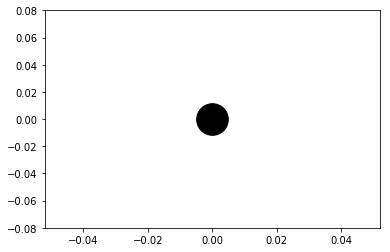
大きい点を描く
plt.scatter(0, 0, c='k', s=1000)
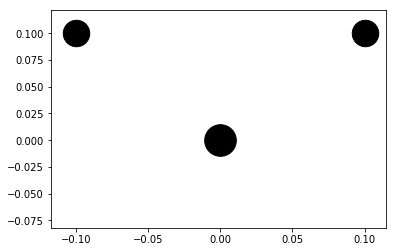
点を増やす
ここで、点の大きさが少し変わったように見えますね。原点にある点の大きさは変えていないはずなんですが、この大きさは、あくまで表示サイズの大きさであって、座標の大きさとは対応していないようです。
plt.scatter(0, 0, c='k', s=1000)
plt.scatter(0.1, 0.1, c='k', s=700)
plt.scatter(-0.1, 0.1, c='k', s=700)
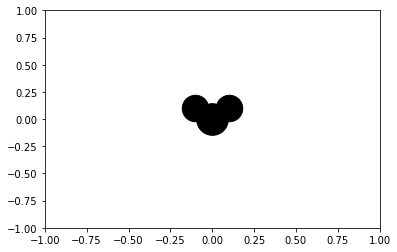
画像の表示域を変える
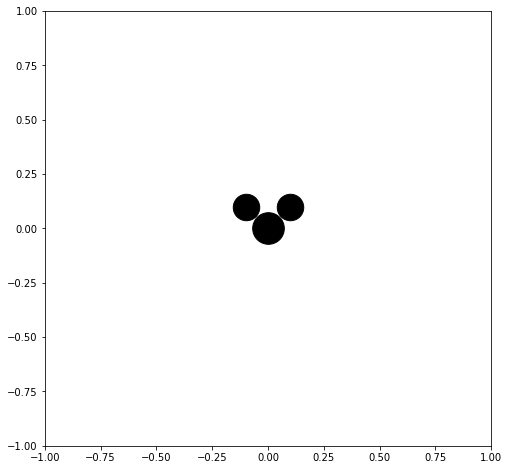
なので、画像を表示する座標域を変えると、全く違って見えます。水分子みたいになってしまいました。
plt.xlim([-1, 1])
plt.ylim([-1, 1])
plt.scatter(0, 0, c='k', s=1000)
plt.scatter(0.1, 0.1, c='k', s=700)
plt.scatter(-0.1, 0.1, c='k', s=700)
画像の縦横比を変える
画像の縦横比を変えても同様に、形が変わって見えます。ミッ...水分子...のように見えます。
plt.figure(figsize=(8,8))
plt.xlim([-1, 1])
plt.ylim([-1, 1])
plt.scatter(0, 0, c='k', s=1000)
plt.scatter(0.1, 0.1, c='k', s=700)
plt.scatter(-0.1, 0.1, c='k', s=700)
画像のサイズを変える
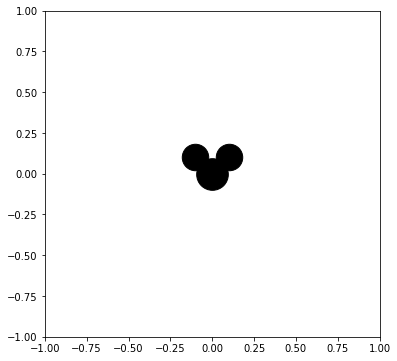
画像のサイズを変えても同様に、形が変わって見えます。ミッ...水分子...のように見えます。
plt.figure(figsize=(6,6))
plt.xlim([-1, 1])
plt.ylim([-1, 1])
plt.scatter(0, 0, c='k', s=1000)
plt.scatter(0.1, 0.1, c='k', s=700)
plt.scatter(-0.1, 0.1, c='k', s=700)
複製をたくさん作る
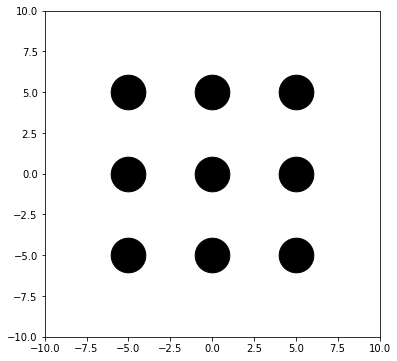
同じものを水平移動して、複製をたくさん描画してみましょう。あれ? 耳...じゃなくて...水素原子?みたいなのが見えなくなってしまいました。
plt.figure(figsize=(6,6))
plt.xlim([-10, 10])
plt.ylim([-10, 10])
for x in [-5, 0, 5]:
    for y in [-5, 0, 5]:
        plt.scatter(0 + x, 0 + y, c='k', s=1200)
        plt.scatter(0.1 + x, 0.1 + y, c='k', s=700)
        plt.scatter(-0.1 + x, 0.1 + y, c='k', s=700)
plt.show()
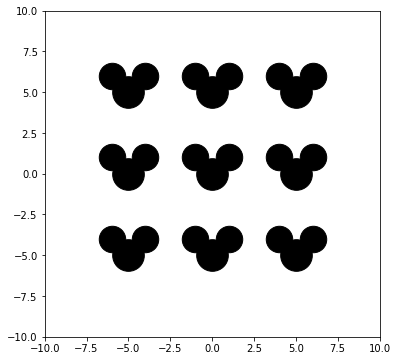
ミッ...水分子みたいな形に戻すためには、位置関係を見直す必要があります。
plt.figure(figsize=(6,6))
plt.xlim([-10, 10])
plt.ylim([-10, 10])
for x in [-5, 0, 5]:
    for y in [-5, 0, 5]:
        plt.scatter(0 + x, 0 + y, c='k', s=1000)
        plt.scatter(1 + x, 1 + y, c='k', s=700)
        plt.scatter(-1 + x, 1 + y, c='k', s=700)
plt.show()
まとめ
matplotlib は便利ですが、点の大きさをいい感じにするのは、ちょっと面倒です。
