階層的クラスタリングは何度も取り扱いましたが、今回は、シルエット係数を用いて、ちょうどよさそうな大きさのクラスターの分割してその中身を見ることを考えてみたいと思います。
都道府県別お酒の消費量データを使います
データの詳細は 実習用データ を参照のこと。「都道府県別アルコール類の消費量」をダウンロードして用います。
# URL によるリソースへのアクセスを提供するライブラリをインポートする。
import urllib.request

# ウェブ上のリソースを指定する
url = 'https://raw.githubusercontent.com/maskot1977/ipython_notebook/master/toydata/sake_dataJ.txt'

# 指定したURLからリソースをダウンロードし、名前をつける。
urllib.request.urlretrieve(url, 'sake_dataJ.txt')
('sake_dataJ.txt', <http.client.HTTPMessage at 0x1058a3048>)
pandas を用いたデータの読み込みと正規化
詳細は タブ区切りデータ、コンマ区切りデータ等の読み込み を参照のこと。
import pandas as pd
df = pd.read_csv('sake_dataJ.txt', sep='\t', index_col=0) # データの読み込み
今回は、axis=1 と指定することで「行ごとの正規化」を行ないます。
# 行列の正規化
dfs = df.apply(lambda x: (x-x.mean())/x.std(), axis=1).fillna(0)
- axis=0 として「列ごとの正規化」をすると、どんなクラスタリング結果になるか
- 正規化を行わないと、どんなクラスタリング結果になるか
ぜひ、後で試してみてください。
階層的クラスタリング
階層的クラスタリングについては 階層的クラスタリング入門の入門 などを参照のこと。
クラスタリングには色んな metric(「距離」の定義)と method (結合方法)があるので、その中からそれぞれ一つずつを選択します。
%matplotlib inline
import matplotlib.pyplot as plt
# metric は色々あるので、ケースバイケースでどれかひとつ好きなものを選ぶ。
# method も色々あるので、ケースバイケースでどれかひとつ好きなものを選ぶ。
from scipy.cluster.hierarchy import linkage, dendrogram
result1 = linkage(dfs.iloc[:, :],
#metric = 'braycurtis',
#metric = 'canberra',
#metric = 'chebyshev',
#metric = 'cityblock',
metric = 'correlation',
#metric = 'cosine',
#metric = 'euclidean',
#metric = 'hamming',
#metric = 'jaccard',
#method= 'single')
method = 'average')
#method= 'complete')
#method='weighted')
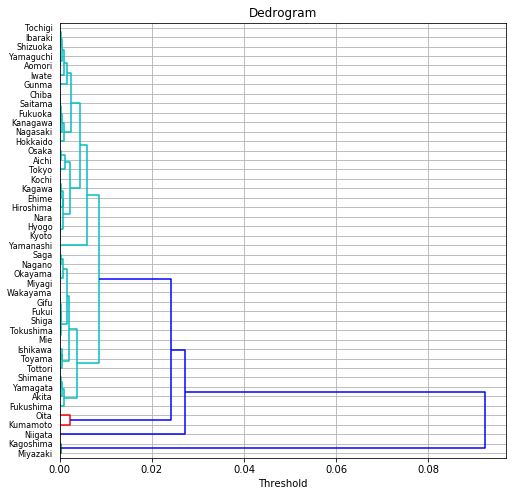
plt.figure(figsize=(8, 8))
dendrogram(result1, orientation='right', labels=list(df.index), color_threshold=0.01)
plt.title("Dedrogram")
plt.xlabel("Threshold")
plt.grid()
plt.show()
階層的クラスタリングの結果ファイル
上記のコードで、階層クラスタリングの結果を result1 という変数に格納しました。これがどういうデータか見てみましょう。
pd.DataFrame(result1)
| 0 | 1 | 2 | 3 | |
|---|---|---|---|---|
| 0 | 27.0 | 28.0 | 0.000026 | 2.0 |
| 1 | 36.0 | 38.0 | 0.000028 | 2.0 |
| 2 | 10.0 | 11.0 | 0.000037 | 2.0 |
| 3 | 23.0 | 35.0 | 0.000038 | 2.0 |
| 4 | 7.0 | 8.0 | 0.000051 | 2.0 |
| 5 | 20.0 | 29.0 | 0.000061 | 2.0 |
| 6 | 25.0 | 46.0 | 0.000066 | 3.0 |
| 7 | 39.0 | 48.0 | 0.000073 | 3.0 |
| 8 | 17.0 | 51.0 | 0.000094 | 3.0 |
| 9 | 1.0 | 34.0 | 0.000131 | 2.0 |
| 10 | 3.0 | 32.0 | 0.000174 | 2.0 |
| ... | ... | ... | ... | ... |
まず、今回のデータは、沖縄県を除く46都道府県からなので、0番目から45番目までのノードから成ります。これらのノードは、メンバー数 1 のクラスタと見なすことができます。
上の表の0行目は、27番目のノードと28番目のノード(ノード間距離=0.000026)を結合して46番目のノードにしたことを意味します。この新しく生成されたクラスタのメンバ数は 2 となります。
同様に1行目は、36番目のノードと38番目のノード(ノード間距離=0.000028)を結合して47番目のノードにしたことを意味します。この新しいクラスタのメンバ数は 2 となります。
同様にどんどん続けると、6行目で、25番目のノードと46番目のノードを結合します。この46番目のノードは、0行目の結合で誕生したノード(クラスタ)です。この新しいクラスタのメンバ数は 3 となります。
... というような、何と何をどういう順番で結合したかという情報が result1 に記述されています。
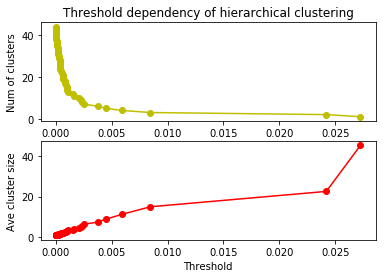
閾値とクラスタ数・平均クラスタサイズの関係
上記のように、距離の短いものから順にどんどん結合していくと、クラスタ数は1つずつ減り、クラスタあたりのメンバ数(クラスタサイズ)は大きくなります。その様子を計算して図示してみましょう。
import numpy as np
import matplotlib.pyplot as plt

# Threshold を変えるとクラスタ数や平均クラスタサイズがどう変わるか調べる
def draw_threshold_dependency(result):
    n_clusters = len(result)
    n_samples = len(result)
    df1 = pd.DataFrame(result)
    x1 = []
    y1 = []
    x2 = []
    y2 = []
    for i in range(len(result) - 1):
        n1 = int(result[i][0])
        n2 = int(result[i][1])
        val = result[i][2]
        n_clusters -= 1
        x1.append(val)
        x2.append(val)
        y1.append(n_clusters)
        y2.append(float(n_samples) / float(n_clusters))

    plt.subplot(2, 1, 1)
    plt.plot(x1, y1, 'yo-')
    plt.title('Threshold dependency of hierarchical clustering')
    plt.ylabel('Num of clusters')
    plt.subplot(2, 1, 2)
    plt.plot(x2, y2, 'ro-')
    plt.xlabel('Threshold')
    plt.ylabel('Ave cluster size')
    plt.show()
draw_threshold_dependency(result1)
指定した閾値でクラスタを得る
次のような関数で、指定した閾値でクラスタを得ることができます。
# 指定した thoreshold でクラスタを得る関数を作る
def get_cluster_by_threshold(result, threshold):
    output_clusters = []
    output_cluster_ids = []
    x_result, y_result = result.shape
    n_clusters = x_result + 1
    cluster_id = x_result + 1
    father_of = {}
    x1 = []
    y1 = []
    x2 = []
    y2 = []
    for i in range(len(result) - 1):
        n1 = int(result[i][0])
        n2 = int(result[i][1])
        val = result[i][2]
        n_clusters -= 1
        if val < threshold:
            father_of[n1] = cluster_id
            father_of[n2] = cluster_id

        cluster_id += 1

    cluster_dict = {}
    for n in range(x_result + 1):
        if n not in father_of:
            output_clusters.append([n])
            continue

        n2 = n
        m = False
        while n2 in father_of:
            m = father_of[n2]
            #print [n2, m]
            n2 = m

        if m not in cluster_dict:
            cluster_dict.update({m:[]})
        cluster_dict[m].append(n)

    output_clusters += cluster_dict.values()

    output_cluster_id = 0
    output_cluster_ids = [0] * (x_result + 1)
    for cluster in sorted(output_clusters):
        for i in cluster:
            output_cluster_ids[i] = output_cluster_id
        output_cluster_id += 1

    return output_cluster_ids
# 指定した thoreshold でクラスタを得る関数を使う。
clusterIDs = get_cluster_by_threshold(result1, 0.005)
print(clusterIDs)
[0, 0, 0, 1, 1, 1, 1, 0, 0, 0, 0, 0, 0, 0, 2, 1, 1, 1, 3, 1, 1, 0, 0, 1, 1, 0, 0, 0, 0, 1, 1, 1, 1, 0, 0, 1, 0, 0, 0, 0, 1, 0, 4, 4, 5, 5]
上記の clusterIDs には、クラスターID(それが何番目のクラスターに所属するか)が格納されます。今回は、0 - 5 の6つのクラスターに分かれました。ところがこの関数には弱点があります。metric などの変数を変えてクラスタリングすると、その「距離」の定義が変わるので、そのたびに閾値がどのくらいかいちいち確認しながら調整しなければいけないのです。
指定したクラスタ数でクラスタを得る
そこで、以下のように、閾値ではなく「いくつのクラスタに分割したいか」で決めることにしてみましょう。
# 指定したクラスタ数でクラスタを得る関数を作る。
def get_cluster_by_number(result, number):
    output_clusters = []
    x_result, y_result = result.shape
    n_clusters = x_result + 1
    cluster_id = x_result + 1
    father_of = {}
    x1 = []
    y1 = []
    x2 = []
    y2 = []
    for i in range(len(result) - 1):
        n1 = int(result[i][0])
        n2 = int(result[i][1])
        val = result[i][2]
        n_clusters -= 1
        if n_clusters >= number:
            father_of[n1] = cluster_id
            father_of[n2] = cluster_id

        cluster_id += 1

    cluster_dict = {}
    for n in range(x_result + 1):
        if n not in father_of:
            output_clusters.append([n])
            continue

        n2 = n
        m = False
        while n2 in father_of:
            m = father_of[n2]
            #print [n2, m]
            n2 = m

        if m not in cluster_dict:
            cluster_dict.update({m:[]})
        cluster_dict[m].append(n)

    output_clusters += cluster_dict.values()

    output_cluster_id = 0
    output_cluster_ids = [0] * (x_result + 1)
    for cluster in sorted(output_clusters):
        for i in cluster:
            output_cluster_ids[i] = output_cluster_id
        output_cluster_id += 1

    return output_cluster_ids
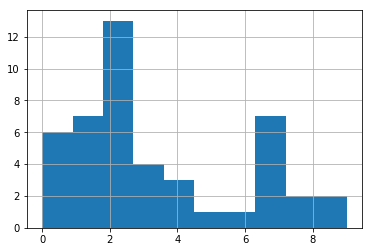
次のようにして「10個のクラスタに分けたい」というふうに指定できます。
clusterIDs = get_cluster_by_number(result1, 10)
print(clusterIDs)
[0, 1, 1, 2, 3, 3, 3, 1, 1, 1, 0, 0, 4, 0, 5, 2, 2, 2, 6, 2, 2, 1, 4, 2, 2, 7, 4, 7, 7, 2, 2, 3, 2, 7, 1, 2, 7, 7, 7, 0, 2, 0, 8, 8, 9, 9]
得られたクラスタのメンバ数の分布は次のようになります。
plt.hist(clusterIDs)
plt.grid()
シルエット係数
シルエット係数は、a を「同じクラスタに属するメンバ間の距離の平均」、b を「異なるクラスタに属するメンバ間の距離の平均」としたときに、
- (b - a) / max(b, a)
で表されます。シルエット係数が高いほど、よく分割できている(クラスタ間距離に比べ、クラスタ内距離が十分に短い)ことを示します。
import math
def silhouette_coefficient(clusters, df):
    a_same = []
    b_diff = []
    for i, j in enumerate(clusters):
        vec1 = df.iloc[i, :].values
        for k, l in enumerate(clusters):
            if i < k:
                vec2 = df.iloc[k, :].values
                dist = 0.
                for v1, v2 in zip(vec1, vec2):
                    dist += (v1 - v2) ** 2
                dist = math.sqrt(dist)
                if j == l: # same cluster
                    a_same.append(dist)
                else: # different cluster
                    b_diff.append(dist)
    a = sum(a_same) / len(a_same)
    b = sum(b_diff) / len(b_diff)
    return (b - a) / max(b, a)
silhouette_coefficient(clusterIDs, df)
0.6192139990573414
ただし、上記のコードで得られたシルエット係数は、距離の定義を「ユークリッド距離」とした場合のシルエット係数になります。
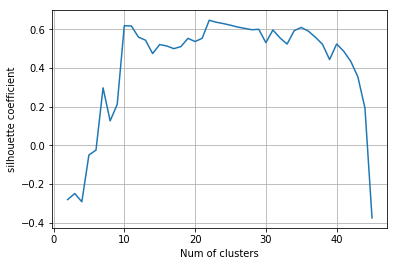
シルエット係数のクラスタ数依存性
次のようにして、クラスタ数を変えた時にシルエット係数がどう変わるかを可視化できます。
x = []
y = []
for i in range(2, len(df)):
    x.append(i)
    y.append(silhouette_coefficient(get_cluster_by_number(result1, i), df))
plt.plot(x, y)
plt.xlabel("Num of clusters")
plt.ylabel("silhouette coefficient")
plt.grid()
plt.show()
計算の高速化
上記の計算手法は時間がかかります。なぜなら、同じ計算(距離の計算)を何度も行なっているからです。そこで、計算した距離は distance_matrix に格納して、それを必要に応じて読み込む形にしましょう。
import math
def get_distance_matrix(df):
    distance_matrix = []
    for i in range(len(df)):
        vec1 = df.iloc[i, :].values
        distance_array = []
        for j in range(len(df)):
            vec2 = df.iloc[j, :].values
            dist = 0.
            for v1, v2 in zip(vec1, vec2):
                dist += (v1 - v2) ** 2
            distance_array.append(math.sqrt(dist))
        distance_matrix.append(distance_array)
    return distance_matrix
def silhouette_coefficient2(clusters, distance_matrix):
    a_same = []
    b_diff = []
    for i, j in enumerate(clusters):
        for k, l in enumerate(clusters):
            if i < k:
                dist = distance_matrix[i][k]
                if j == l: # same cluster
                    a_same.append(dist)
                else: # different cluster
                    b_diff.append(dist)
    a = sum(a_same) / len(a_same)
    b = sum(b_diff) / len(b_diff)
    return (b - a) / max(b, a)
distance_matrix = get_distance_matrix(df)
x = []
y = []
for i in range(2, len(df)):
    x.append(i)
    y.append(silhouette_coefficient2(get_cluster_by_number(result1, i), distance_matrix))
plt.plot(x, y)
plt.xlabel("Num of clusters")
plt.ylabel("silhouette coefficient")
plt.grid()
plt.show()
これで、結果は変わらず、高速化ができたことと思います。
クラスタに分割して中身を見る
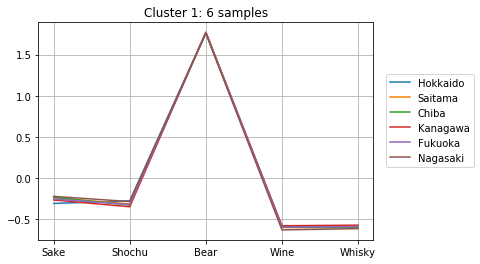
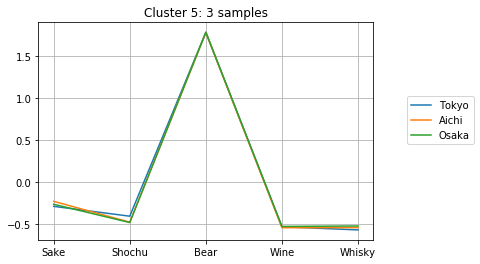
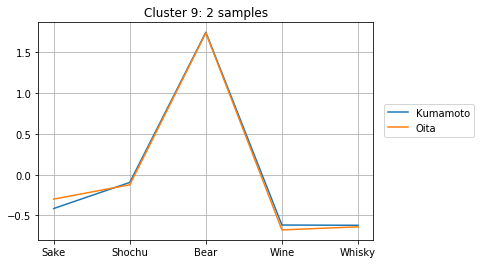
上記の計算より、クラスタ数が10個の時にシルエット数が極大になることが分かりました。そこで、クラスタ数を10個として、どのようなクラスターが得られたか確認してみましょう。
clusterIDs = get_cluster_by_number(result1, 10)
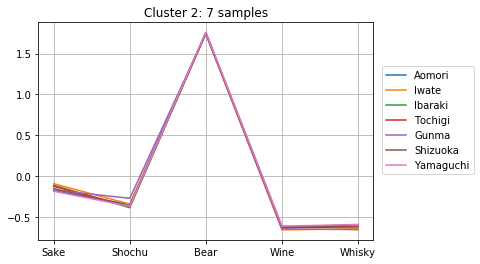
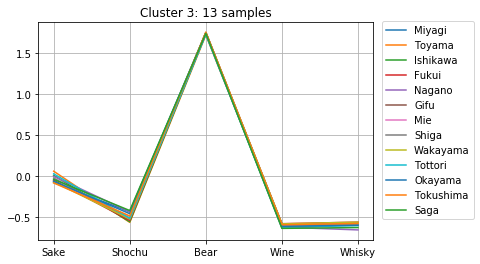
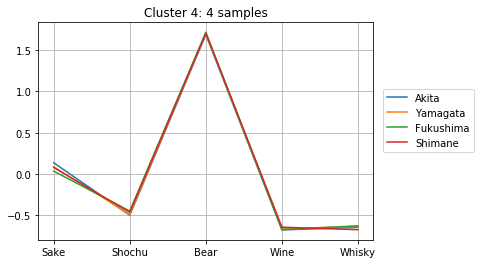
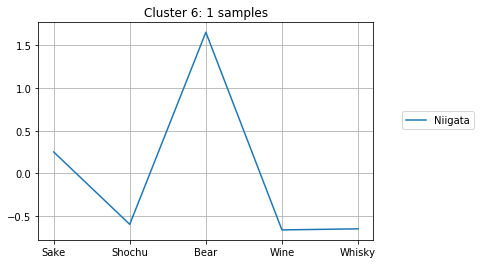
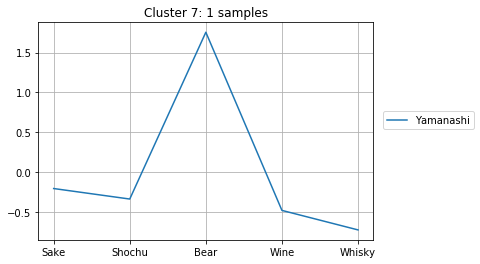
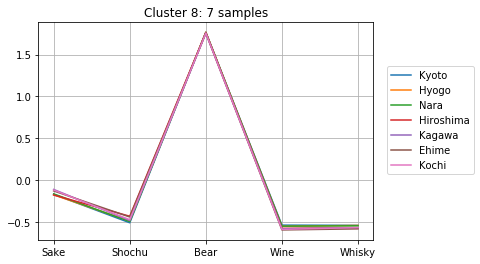
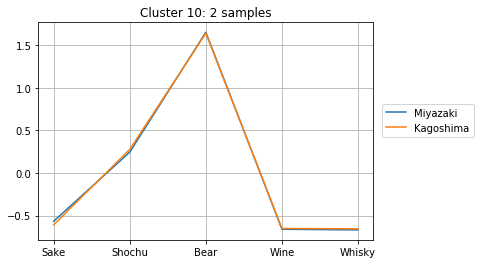
次のようにして、10個のクラスターのメンバーとそのアルコール消費量が確認できます。どのように分かれたか、得られたグラフをよくみて考察してみましょう。
for i in range(max(clusterIDs) + 1):
    cluster = []
    for j, k in enumerate(clusterIDs):
        if i == k:
            cluster.append(j)
    plt.title("Cluster {}: {} samples".format(i + 1, len(cluster)))
    for j in cluster:
        plt.plot(dfs.iloc[j, :], label=dfs.index[j])
    plt.legend( loc = 'center right',
          bbox_to_anchor = (0.8, 0.5, 0.5, 0.1),
          borderaxespad = 0.0)
    plt.grid()
    plt.show()
課題
「行ごとの正規化」を「列ごとの正規化」「正規化しない」などに変更した場合どのように結果が変わるか確認し、「正規化」の効果を考察しましょう。
また、階層クラスタリングの metric や method を変えた時にどのように結果が変わるか確認しましょう。