「バイオリンプロットの本当の描き方を見せてやる」という記事を過去に書きましたが、その続編として、OptunaとPILを使った描き方を見せてやることにします。
バイオリンのシルエット画像
バイオリンって、ほら、こんな形をしてるじゃないですか。
from PIL import Image
import numpy as np

img_violin = Image.open('violin.png')
im_violin = np.array(img_violin)
img_violin

出典:http://happy-koujimachi.com/?p=410
この画像のサイズを測ってみますね。
im_violin.shape
(880, 330, 4)
白なら0, 黒なら1 の配列にしてやります。
violin_01 = np.where(im_violin[:, :, 0] == 255, 1, 0)
バイオリンプロット
それでは、バイオリンプロットを普通に描いてみましょう。こんな感じです。
import random
import numpy as np
import matplotlib.pyplot as plt

dataset = []
for _ in range(2):
    dataset += list(np.random.normal(random.random() * 100, random.random() * 100, (int(random.random() * 100))))

plt.violinplot(dataset)
plt.show()
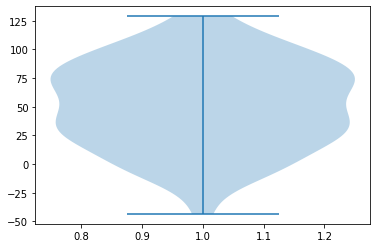
これを、バイオリンプロットという名にふさわしい形で出力してやろうというのが今回の目的です。
教師セットと同じサイズの画像として出力する
本物のバイオリンのシルエット画像を教師セットとします。それに類似したバイオリンプロットを描くために、バイオリンプロットの画像を教師セットと同じサイズの画像として出力します。
こちらの記事を参考に関数を作成してみました。
https://qiita.com/code0327/items/43118813b6085dc7e3d1
import matplotlib.pyplot as plt
from mpl_toolkits.axes_grid1 import Divider, Size
from mpl_toolkits.axes_grid1.mpl_axes import Axes

def violin(
    dataset,
    ax_w_px = 400, # プロット領域の高さをピクセル単位で指定
    ax_h_px = 300,  # プロット領域の高さをピクセル単位で指定
    # サイズ指定のための処理 ↓↓ ここから ↓↓
    fig_dpi = 100,
    ax_margin_inch = (0, 0, 0, 0),  # Left,Top,Right,Bottom [inch]
    flag_show = True,
    title = ""
):
    ax_w_inch = ax_w_px / fig_dpi
    ax_h_inch = ax_h_px / fig_dpi
    fig_w_inch = ax_w_inch + ax_margin_inch[0] + ax_margin_inch[2]
    fig_h_inch = ax_h_inch + ax_margin_inch[1] + ax_margin_inch[3]

    fig = plt.figure( dpi=fig_dpi, figsize=(fig_w_inch, fig_h_inch))
    ax_p_w = [Size.Fixed(ax_margin_inch[0]),Size.Fixed(ax_w_inch)]
    ax_p_h = [Size.Fixed(ax_margin_inch[1]),Size.Fixed(ax_h_inch)]
    divider = Divider(fig, (0.0, 0.0, 1.0, 1.0), ax_p_w, ax_p_h, aspect=False)
    ax = Axes(fig, divider.get_position())
    ax.set_axes_locator(divider.new_locator(nx=1,ny=1))
    fig.add_axes(ax)
    # サイズ指定のための処理 ↑↑ ここまで ↑↑

    ax.violinplot(dataset)
    ax.axis("off")
    fig.canvas.draw()
    im = np.array(fig.canvas.renderer.buffer_rgba())
    plt.title(title)
    if flag_show:
        plt.show()
    else:
        plt.close()

    return im
さて、同じサイズのバイオリンプロットがこちらになります。
im = violin(
    dataset,
    ax_w_px = violin_01.shape[1],  # プロット領域の幅をピクセル単位で指定
    ax_h_px = violin_01.shape[0],  # プロット領域の高さをピクセル単位で指定
    title = "cool violin"
)

まだまだ「バイオリン」とは言えませんね。今度はこれを、白黒画像に変換します。
from PIL import Image

def im2_r(im):
    img = Image.fromarray(im)
    r, g, b, x = img.split()
    src_color = (255, 255, 255)

    _r = r.point(lambda _: 1 if _ == src_color[0] else 0, mode="1")
    _g = g.point(lambda _: 1 if _ == src_color[1] else 0, mode="1")
    _b = b.point(lambda _: 1 if _ == src_color[2] else 0, mode="1")
    return _r
白黒画像に変換したバイオリンプロットです。
im2_r(im)

これを、教師セットと同じサイズの配列として表現します。
plot_01 = np.where(im2_r(im), 1, 0)
plot_01.shape
(880, 330)
目的関数
教師セット(バイオリンのシルエット画像)とバイオリンプロットの白黒画像を比較して、違いのあるピクセルの数を数えます。その数の最小化を目指すということになります。
np.abs(plot_01 - violin_01).sum()
80378
Optuna のインストール
!pip install optuna
目的関数の設計
ベストスコアが更新されたときにそのバイオリンプロットを出力するようにしましょう。
class Objective:
    def __init__(self):
        self.best_dataset = []
        self.best_score = 1e53
        self.n_trial = 0

    def __call__(self, trial):
        self.n_trial += 1
        dataset = []
        n_mountains = 100
        for n in range(n_mountains):
            dataset += list(n + np.random.rand(trial.suggest_int("n_" + str(n), 0, 1000)))

        im = violin(
            dataset,
            ax_w_px = violin_01.shape[1],  # プロット領域の幅をピクセル単位で指定
            ax_h_px = violin_01.shape[0],  # プロット領域の高さをピクセル単位で指定
            flag_show = False,
            title = "Trial {}".format(self.n_trial)
            )
        plot_01 = np.where(im2_r(im), 1, 0)
        score = np.abs(plot_01 - violin_01).sum()

        if self.best_score > score:
            self.best_score = score
            self.best_dataset = dataset
            Image.fromarray(im)
            plt.title("Trial {}, score = {}".format(self.n_trial, score))
            plt.imshow(im)
            plt.show()
            try:
                print(study1.best_trial)
            except:
                pass

        return score
実行
さあ、最初はバイオリンとは似ても似つかない姿だったのが、次第に...
import optuna

optuna.logging.set_verbosity(optuna.logging.WARN)
objective1 = Objective()
study1 = optuna.create_study(direction='minimize')
# study1.optimize(objective1, timeout=60)
study1.optimize(objective1, n_trials=1000, show_progress_bar=True)
study1.best_trial

... これはどう見てもバイオリンですありがとうございます(`・ω・´)キリッ