バイオインフォマティクスという分野の研究者ならほとんど誰でも知っている「ウニプロット」をmatplotで描いてみたくなったが、調べても方法がわからない。そもそも、画像ファイルをプロットのマーカーにする方法も調べても分からない。そこで、既存のマーカーを組み合わせてウニっぽく見えるようにしてみた。
様々なマーカーのプロット
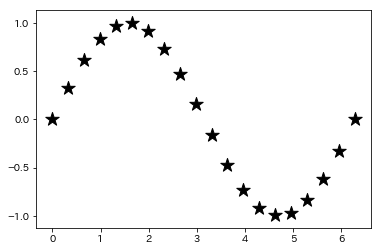
matplotlib で使える marker を全て試してみる-pythonを参考に、マーカーの大きさとズレを微調整しながら描いてみる。
%matplotlib inline
import matplotlib.pyplot as plt
import numpy as np
import math
x = np.linspace(0, 2.0 * math.pi, 20)
y = np.sin(x)
from collections import OrderedDict
markers = OrderedDict([
('*', [200, 0, 0]),
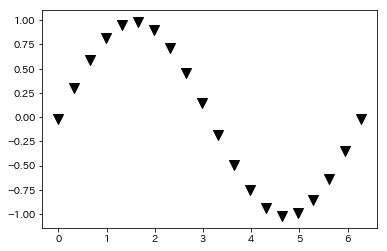
('v', [100, 0, -0.02]),
('<', [70, -0.05, -0.01]),
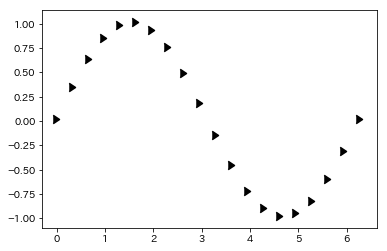
('>', [70, 0.05, -0.01]),
(4, [70, -0.035, 0.02]),
(5, [70, 0.035, 0.02]),
])
for m, s in markers.items():
plt.scatter(x + s[1], y + s[2], marker=m, c="black", s=s[0])
plt.show()


ウニプロットの完成
以上のプロットを重ね合わせると...
from collections import OrderedDict
markers = OrderedDict([
    ('*', [200, 0, 0]),
    ('v', [100, 0, -0.02]),
    ('<', [70, -0.05, -0.01]),
    ('>', [70, 0.05, -0.01]),
    (4, [70, -0.035, 0.02]),
    (5, [70, 0.035, 0.02]),
])
for m, s in markers.items():
    plt.scatter(x + s[1], y + s[2], marker=m, c="black", s=s[0])
plt.show()
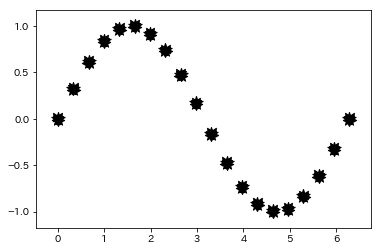
できた!!!ウニっぽい!