PyQtGraphでグラフを描くためのメモです。
完成形は、以下のイメージです。実行時のグラフは非表示で、Plotボタンを押すとグラフ表示が行われ、Quitボタンで終了するという単純なものです。

手順
PyQtGraphでグラフを描く際の手順は、以下のとおりとします。
- QtDesignerでUIを作成
- グラフを描くコードを記述
- 実行
結論
本稿の操作で、以下のコードが得られます。
先ずは、QtDesignerで読み込むことができるxmlファイルです。
mainUi.ui
<?xml version="1.0" encoding="UTF-8"?>
<ui version="4.0">
 <class>Form</class>
 <widget class="QWidget" name="Form">
  <property name="geometry">
   <rect>
    <x>0</x>
    <y>0</y>
    <width>800</width>
    <height>600</height>
   </rect>
  </property>
  <property name="windowTitle">
   <string>Form</string>
  </property>
  <layout class="QGridLayout" name="gridLayout">
   <item row="0" column="0">
    <layout class="QVBoxLayout" name="verticalLayout"/>
   </item>
   <item row="1" column="0">
    <layout class="QHBoxLayout" name="horizontalLayout">
     <item>
      <spacer name="horizontalSpacer">
       <property name="orientation">
        <enum>Qt::Horizontal</enum>
       </property>
       <property name="sizeHint" stdset="0">
        <size>
         <width>40</width>
         <height>20</height>
        </size>
       </property>
      </spacer>
     </item>
     <item>
      <widget class="QPushButton" name="pltBtn">
       <property name="text">
        <string>Plot</string>
       </property>
      </widget>
     </item>
     <item>
      <widget class="QPushButton" name="quitBtn">
       <property name="text">
        <string>Quit</string>
       </property>
      </widget>
     </item>
    </layout>
   </item>
  </layout>
 </widget>
 <resources/>
 <connections>
  <connection>
   <sender>quitBtn</sender>
   <signal>clicked()</signal>
   <receiver>Form</receiver>
   <slot>close()</slot>
   <hints>
    <hint type="sourcelabel">
     <x>359</x>
     <y>215</y>
    </hint>
    <hint type="destinationlabel">
     <x>252</x>
     <y>4</y>
    </hint>
   </hints>
  </connection>
 </connections>
</ui>
続いて、pyuic5でpythonに変換したファイル
mainUi.py
from PyQt5 import QtCore, QtGui, QtWidgets

class Ui_Form(object):
    def setupUi(self, Form):
        Form.setObjectName("Form")
        Form.resize(800, 600)
        self.gridLayout = QtWidgets.QGridLayout(Form)
        self.gridLayout.setObjectName("gridLayout")
        self.verticalLayout = QtWidgets.QVBoxLayout()
        self.verticalLayout.setObjectName("verticalLayout")
        self.gridLayout.addLayout(self.verticalLayout, 0, 0, 1, 1)
        self.horizontalLayout = QtWidgets.QHBoxLayout()
        self.horizontalLayout.setObjectName("horizontalLayout")
        spacerItem = QtWidgets.QSpacerItem(40, 20, QtWidgets.QSizePolicy.Expanding, QtWidgets.QSizePolicy.Minimum)
        self.horizontalLayout.addItem(spacerItem)
        self.pltBtn = QtWidgets.QPushButton(Form)
        self.pltBtn.setObjectName("pltBtn")
        self.horizontalLayout.addWidget(self.pltBtn)
        self.quitBtn = QtWidgets.QPushButton(Form)
        self.quitBtn.setObjectName("quitBtn")
        self.horizontalLayout.addWidget(self.quitBtn)
        self.gridLayout.addLayout(self.horizontalLayout, 1, 0, 1, 1)

        self.retranslateUi(Form)
        self.quitBtn.clicked.connect(Form.close)
        QtCore.QMetaObject.connectSlotsByName(Form)

    def retranslateUi(self, Form):
        _translate = QtCore.QCoreApplication.translate
        Form.setWindowTitle(_translate("Form", "Form"))
        self.pltBtn.setText(_translate("Form", "Plot"))
        self.quitBtn.setText(_translate("Form", "Quit"))
グラフ描画用のコードは、以下のとおりです。ファイル名はmain.pyとしました。
main.py
import sys
from PyQt5 import QtWidgets
import numpy as np
import pyqtgraph as pg

from PyQt5 import uic
class GraphWindow(QtWidgets.QWidget):
    def __init__(self, *args, **kwargs):
        super(GraphWindow, self).__init__(*args, **kwargs)
        uic.loadUi('mainUi.ui', self)


        # ここからは共通
        self.p1, self.p2 = self.set_graph_ui()
        self.pltBtn.clicked.connect(self.plot)

    def set_graph_ui(self):
        pg.setConfigOptions(antialias=True)
        win = pg.GraphicsLayoutWidget()
        self.verticalLayout.addWidget(win)

        p1 = win.addPlot()
        p1.setAutoVisible(y=True)

        win.nextRow()
        p2 = win.addPlot()
        p2.setAutoVisible(y=True)

        return p1, p2


    def plot(self):
        self.p1.clear()
        self.p2.clear()
        t = np.linspace(0, 20, 200)
        y_cos = np.cos(t)
        data1 = 10000 + 15000 * pg.gaussianFilter(np.random.random(size=10000), 10) + 3000 * np.random.random(size=10000)
        data2 = 15000 + 15000 * pg.gaussianFilter(np.random.random(size=10000), 10) + 3000 * np.random.random(size=10000)

        self.p1.plot(data1, pen="r")
        self.p1.plot(data2, pen="g")
        self.p2.plot(data1, pen="w")


if __name__ == '__main__':
    app = QtWidgets.QApplication(sys.argv)
    myWin = GraphWindow()
    myWin.show()
    sys.exit(app.exec_())
上記のコードは、uiファイルをロードする場合のコードです。pyファイルをロードする場合は、以下のコードとなります。
from mainUiMW import Ui_MainWindow
class GraphWindow(QtWidgets.QMainWindow, Ui_MainWindow):
    def __init__(self):
        super(GraphWindow, self).__init__()
        self.setupUi(self)
を以下のように変更すればOKです。
from PyQt5 import uic
class GraphWindow(QtWidgets.QWidget):
    def __init__(self, *args, **kwargs):
        super(GraphWindow, self).__init__(*args, **kwargs)
        uic.loadUi('mainUi.ui', self)
QtDesignerでUIを作成
上記のUIは以下の手順で作成します。
QtDesignerを起動すると、以下の画面が表示されます。

Main WindowもしくはWidgetが選択できます。
ステータスバーやメニューを使用したい場合は、Main Windowを選択してください。
簡易なWindowのみの場合は、Widgetで良いでしょう。
Widgetを選択する場合
Widgetで作成する手順は以下のとおりです。
まずは、Widgetを選択します。

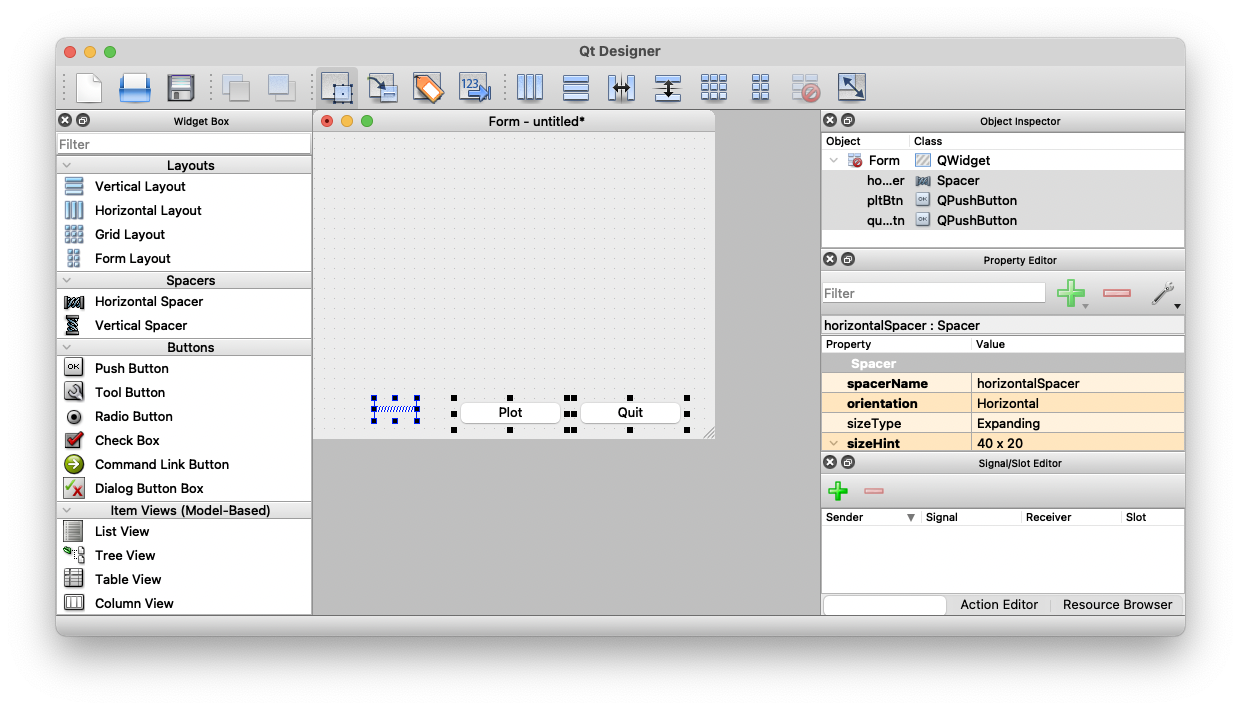
Widget BoxからPush Buttonを2つ並べて、それぞれプロパティと値を変更
Plot用はobjectNameを「Plot」に、textを「pltBtn」に、Quit用は「Quit」「quitBtn」に変更
Horizontal Spacerを並べる

次に、先ほどのウィジェット(ボタン、スペーサー)を全て選択し
上にあるHrizontal layoutボタンを押すと、図のようになります。

Widget boxから、Vertical Layoutをドラッグして配置


ウィジェットを選択していない状態で、上のLay Out in Gridを選択すると以下のようになります。

続いて、Quitボタンの動作設定をします。

上にあるEdit Signals/Slotsボタンを押すと、次の画面になります。

Quitボタンをクリックし、赤線が以下の図のようになる位置でリリースします。
フォームをクローズするので、フォームをクローズしたいのでフォーム上でリリースする必要があります。メニューバー付近でリリースすると良いかと思います。

リリースすると以下の画面となります

OKを選択すると、以下のようになります。

動作確認を行います。
MacではCommand-Rを実行すると、以下のようなWindowが開きますので、Quitボタンを押下してみてください。
Windowが閉じればOKです。
最後にウィンドウサイズを800x600に変更します。

適当な名前で保存します。ここでは「mainUi.ui」とします。
Main Windowを使用する場合も同じように染ます。
名前は、mainUiMW.uiとします。
次にpythonのコードに変換します。
% pyuic5 mainUi.ui -o mainUi.py
% pyuic5 mainUiMW.ui -o mainUiMW.py