さてさて ゼロから作るDeep Learning ―Pythonで学ぶディープラーニングの理論と実装 を絶賛学習中です。。
あるデータの列から、教師データとテストデータを重複なくランダムに取得したい
Pythonでニューラルネットワークをあつかっていると、自前でテストデータの列を用意したいときがたびたびあります。
「あー、$y = 0.5x +3$ のデータ$(x,y)$を $(-5,5)$の区間で100コ欲しいなぁ、ランダムに取り出して90コは教師データ、10コはテストデータとしたいなぁ。。テストデータは学習にはつかえないので、重複なく取り出したいなぁ。。」なんてケースですね。。
やってみる
まずはx軸側。Python の数値計算ライブラリであるNumPyは
>>> import numpy as np
>>> targets = np.array([10,20,30,40,50])
>>> index = [1,2,3]
>>> targets[index]
array([20, 30, 40])
のようにnumpy配列に対して配列番号の列[1,2,3] などを渡すことで、その配列番号のデータだけを取得することができます。
よってたとえば、データ数data_size=10、教師データ数train_size=6、-5.0〜5.0で、1.0 刻みのデータを作成し、教師データ列とテストデータ列に分けるにはこんな感じにします。
>>> import numpy as np
>>> data_size = 10
>>> train_size = 6
>>> train_index = np.sort(np.random.choice(data_size, train_size, replace=False))
>>> train_index
array([1, 2, 3, 4, 6, 7])
>>> x_all = np.arange(-5.0,5.0, 10.0/data_size)
>>> x_all
array([-5., -4., -3., -2., -1.,  0.,  1.,  2.,  3.,  4.])
>>> x_train = x_all[train_index]
>>> x_train
array([-4., -3., -2., -1.,  1.,  2.])
>>>
>>> x_test = np.delete(x_all, train_index)
>>> x_test
array([-5.,  0.,  3.,  4.])
>>>
np.random.choice(data_size, train_size, replace=False) で 0〜data_size -1 からtrain_sizeコのデータを取り出すことで、教師データ用の配列番号の列train_indexを作成しました。replace=Falseは重複を許可しないオプションです。そしてそれをソートしておきます。
そして train_index を用いて全データ x_all から教師データx_trainを作成しました。
残りのデータをテストデータx_testとしたいですが、ちょっとスマートなやり方が見つからず、、、下記の通り、x_allから、train_indexのデータを除去して、残りを取得しました。
x_test = np.delete(x_all, train_index)
結果、
>>> x_train
array([-4., -3., -2., -1.,  1.,  2.])
>>> x_test
array([-5.,  0.,  3.,  4.])
>>>
と振り分けることができましたー。。
関数を呼び出して、x_train,x_testから、t_train,t_testを作成する
つづいてy軸側。
def f(x):
    return 0.5 * x + 3.0
などを用いて、t_train,t_testを作成します。コードの全体はこんな感じです。
# !/usr/bin/env python
# -*- coding: utf-8 -*-

import sys

from matplotlib import pyplot as plt
import numpy as np


def f(x):
    return 0.5 * x + 3.0


def get_data(data_size, train_size=None, train_ratio=0.9, start=-5.0, end=5.0):
    if train_size is None:  # 教師データ数が引数から取れない場合は、
        train_size = int(data_size * train_ratio)  # うち教師データの割合から、教師データ数を計算

    train_index = np.sort(np.random.choice(data_size, train_size, replace=False))  # data から train だけの配列番号をつくる

    # まずdata_sizeコの、全データを作成
    x_all = np.arange(start, end, (end - start) / data_size)  # 数直線を作成。
    t_all = f(x_all)  # 全体のyのデータを算出
    # t_all += np.random.normal(0, 0.3, data_size)  # ちょっとだけノイズをたす
    # 全データ作成、以上

    x_train = x_all[train_index]
    t_train = t_all[train_index]
    x_test = np.delete(x_all, train_index)
    t_test = np.delete(t_all, train_index)

    # つくったデータ達は横向きになってるのでreshapeして、縦向きに。
    x_train = x_train.reshape(len(x_train), 1)
    t_train = t_train.reshape(len(t_train), 1)

    # つくったデータ達は横向きになってるのでreshapeして、縦向きに。
    x_test = x_test.reshape(len(x_test), 1)
    t_test = t_test.reshape(len(t_test), 1)

    return (x_train, t_train), (x_test, t_test)


def main(args):
    data_size = 100  # 母集団のデータ数
    (x_train, t_train), (x_test, t_test) = get_data(data_size, train_ratio=0.9)

    print(f'教師データ数:{x_train.shape}')
    print(f'テストデータ数:{x_test.shape}')
    print('xの値:' + str(x_train))
    print('yの値:' + str(t_train))

    fig = plt.figure()

    ax1 = fig.add_subplot(2, 1, 1)
    ax2 = fig.add_subplot(2, 1, 2)

    ax1.scatter(x_train, t_train, label='教師データ')
    ax1.set_xlabel('x_train')
    ax1.set_ylabel('t_train')
    ax1.grid(True)  # グリッド線

    ax2.scatter(x_test, t_test, label='テストデータ')

    ax2.set_xlabel('x_test')
    ax2.set_ylabel('t_test')
    ax2.grid(True)  # グリッド線

    plt.tight_layout()  # タイトルの被りを防ぐ

    # グラフに情報を表示
    plt.show()

    # plt.scatter(x_test, t_test, label='テストデータ')
    # plt.show()


if __name__ == "__main__":
    main(sys.argv)
実行してみます。
(venv) $ python test_data_samples.py
教師データ数:(90, 1)
テストデータ数:(10, 1)
xの値:[[-5.00000000e+00]
 [-4.90000000e+00]
 [-4.80000000e+00]
 [-4.70000000e+00]
 [-4.60000000e+00]
 [-4.50000000e+00]
 ...

 [ 4.50000000e+00]
 [ 4.60000000e+00]
 [ 4.70000000e+00]
 [ 4.80000000e+00]
 [ 4.90000000e+00]]
yの値:[[0.5 ]
 [0.55]
 [0.6 ]
 [0.65]
 [0.7 ]
 [0.75]
 ...

 [5.25]
 [5.3 ]
 [5.35]
 [5.4 ]
 [5.45]]
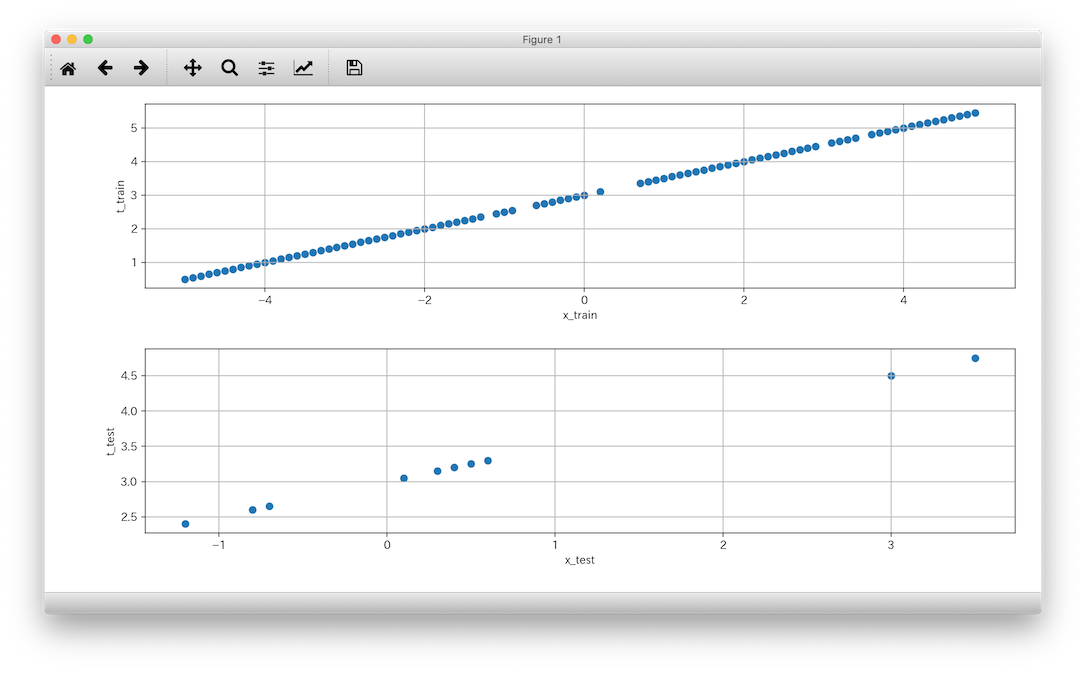
うん、ちゃんと分けられてそうだし、関数の結果をt_train,t_testとして取得できていそうですね。
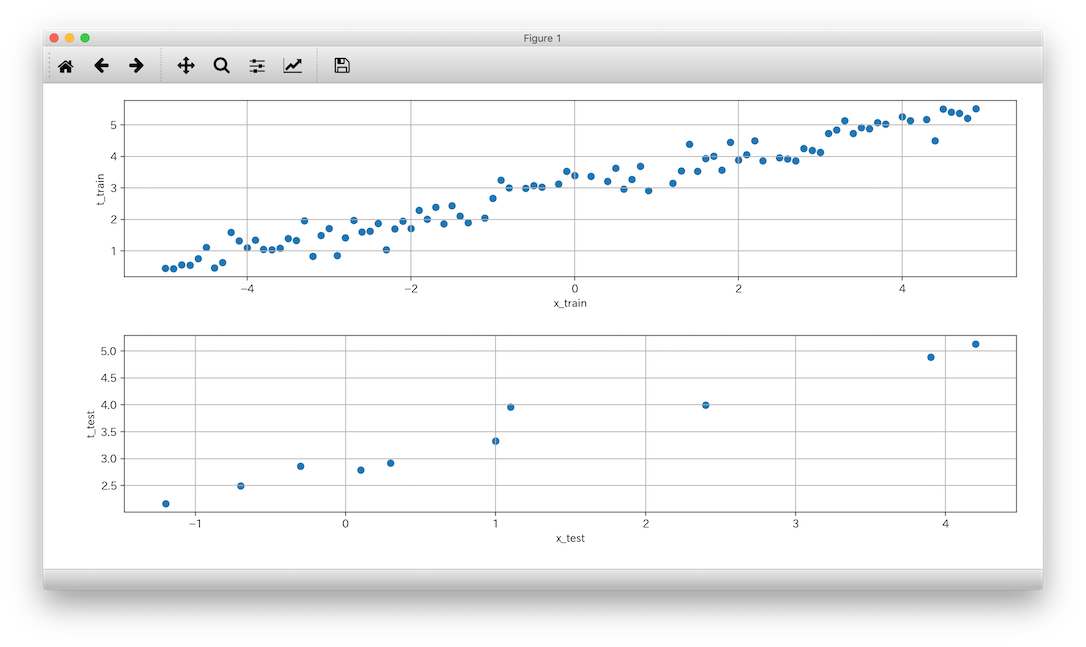
もうすこしデータにバラツキをくわえる
さて作成したy軸側のデータは、
def f(x):
    return 0.5 * x + 3.0
コレで作成したテストデータなのでキレイに並んじゃってますが、y方向にバラツキをくわえるには、
t_all = f(x_all)  # 全体のyのデータを算出
# t_all += np.random.normal(0, 0.3, data_size)  # ちょっとだけノイズをたす
このコメントを外して実行してみます。正規分布(上記だと平均0,標準偏差0.3にしたがう)に従った値を各要素に加味したデータになります。
おつかれさまでした。。