はじめに
かなり古いが ICCV2017 より以下の論文
[1] S. Motiian, et. al. Unified Deep Supervised Domain Adaptation and Generalization. ICCV2017.
のまとめ。
-
CVF open access
https://openaccess.thecvf.com/content_iccv_2017/html/Motiian_Unified_Deep_Supervised_ICCV_2017_paper.html -
github
https://github.com/samotiian/CCSA
Keras実装
既に多くの解説があると思うので、備忘録的に気になった点のみまとめ。
概要
- 画像データに対して教師あり domain adaptation する系のモデルで、特にターゲットのデータが少数の場合の手法
- CNNで畳み込んだ後の embedding subspace でソースとターゲットのクラスが同じ場合は近づけ、異なる場合は話すように学習させる
以下の図において
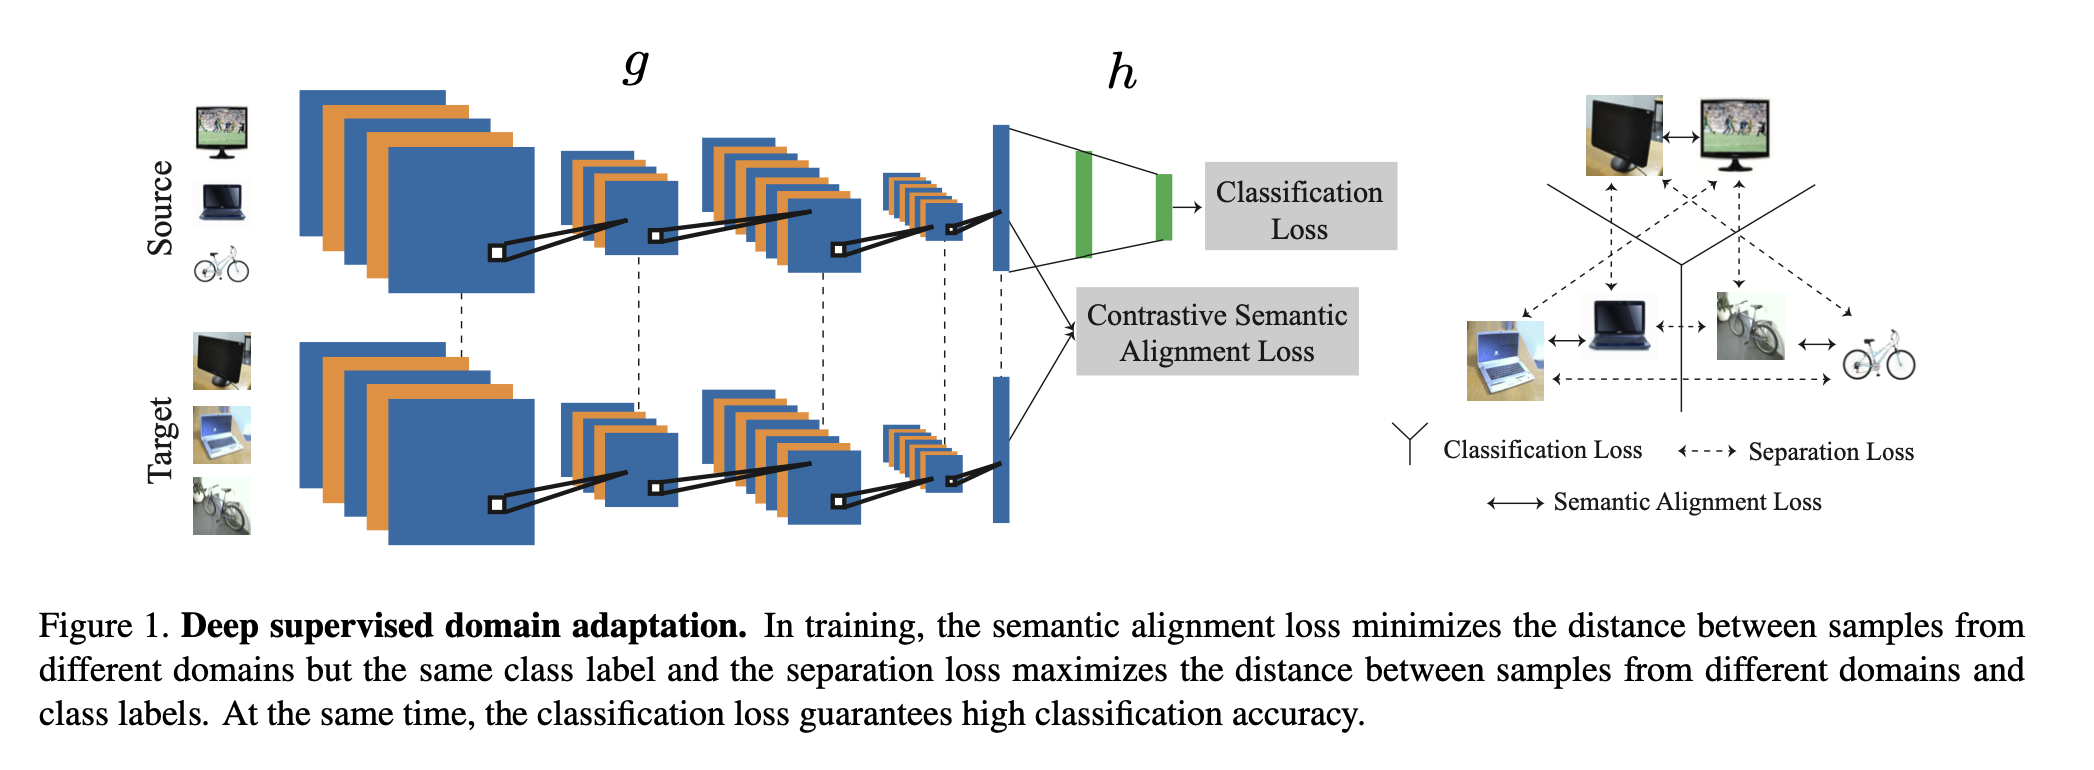
([1] Figure1より)
- SourceとTargetは同じCNNでembedding subspaceへ写像させる
- Sourceはclassification lossで学習させる
- SourceとTargetはembedding subspaceにおいてConstrastive Semantic Alignment lossなるもので学習させる
- 具体的には図中右のように、同じクラスの場合は semantic alignment loss で近づけ、異なるクラスの場合は separation loss で遠ざける
手法
定義
大量(N個)にあるソース・ドメインのdatasetを
\mathcal{D}_s = \{ (x^s_i, y^s_i) \}^{N}_{i=1}
とする。x:data(画像)、y:ラベル。
同様に少量(M個)しかないターゲット・ドメインのdatasetを
\mathcal{D}_t = \{ (x^t_i, y^t_i) \}^{N}_{i=1}
$g : \mathcal{X} \rightarrow \mathcal{Z}$ ・・・ネットワークのうち入力画像を畳み込んで特徴空間へembeddingする部分
$h : \mathcal{Z} \rightarrow \mathcal{Y}$ ・・・ネットワークのうち特徴量を分類してラベルを出力する部分g
$f =h \circ g $ ・・・ネットワーク全体
Lossの全体
本手法では3種類のlossを最小化する事で実現する(以下、式の番号は論文と一致)
\mathcal{L}_{CCSA} (f) = \mathcal{L}_{C} (h \circ g) + \mathcal{L}_{SA}(g) + \mathcal{L}_{S}(g) \tag{5}
classification loss
source domainのデータに対して通常のclassification lossを用いる。
\mathcal{L}_{C} (f) = E[\ell (f(X^2), Y) ] \tag{1}
semantic alignment loss
embedding subspace においてサンプリングした同じラベルのsourceドメインのデータとtargetドメインのデータとの間で距離を最小化させる。
\begin{eqnarray}
\mathcal{L}_{SA}(g) &=& \sum_{i,j} d(g(x^s_i), g(x^t_j)) \tag{7} \\
 &=& \sum_{i,j} \frac{1}{2} \| (g(x^s_i) - g(x^t_j)\|^2 \tag{9}
\end{eqnarray}
$| | \cdot | |$ はフロベニウスノルム。
separation loss
一方で embedding subspace においてサンプリングした異なるラベルのsourceドメインのデータとtargetドメインのデータとの間で距離を一定以上に保つ。
\begin{eqnarray}
\mathcal{L}_{S}(g) &=& \sum_{i,j} k(g(x^s_i), g(x^t_j)) \tag{8} \\
 &=& \sum_{i,j} \frac{1}{2} \max(0, m - \| (g(x^s_i) - g(x^t_j)\| )^2 \tag{10}
\end{eqnarray}
m - フロベニウスノルムと0とのmaxを求めているので、m - フロベニウスノルムの部分は0以下に収束 -> フロベニウスノルムの部分は m 以上に収束、となる。
実験と結果
以下の図は Office dataset における定量的評価。メトリクスはaccuracy。
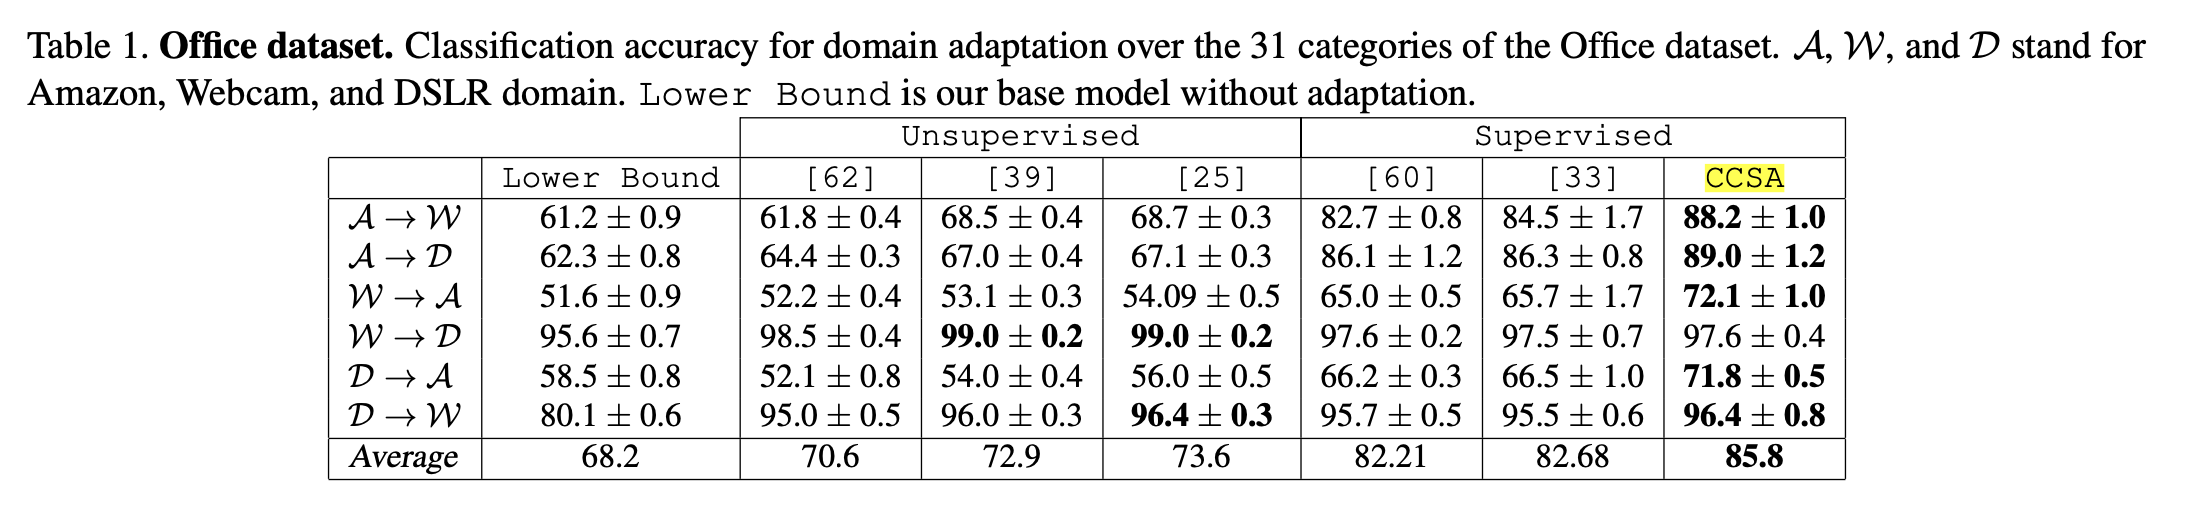
([1] Table1より)
CCSAが本手法。教師ありDAの既存手法より精度がよい。
その後の教師ありDAモデル
例えば 2021年段階の論文
[2] L. Hedegaard, et. al. Supervised Domain Adaptation:A Graph Embedding Perspective and a Rectified Experimental Protocol. IEEE Transactions on Image Processing 2021.
https://arxiv.org/pdf/2004.11262.pdf
における定量的評価でも本手法CCSAは
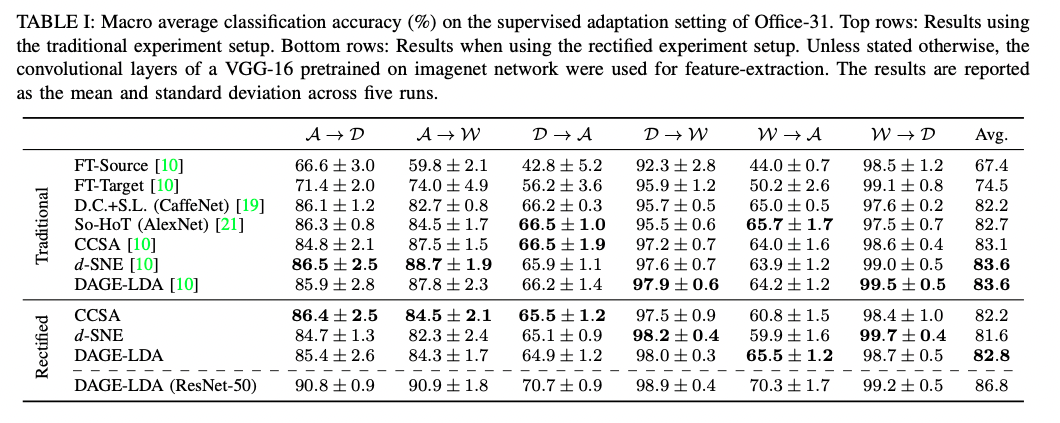
([2] table2より)
と検討している。