はじめに
”Googleデジタルマーケティング&Eコマース プロフェッショナル認定証" の受講が完了しました(2022/3/3)。私がこのコースから得られた素晴らしい体験を、テーマごとに分割して、わかりやすくご紹介しています。興味を持たれた方は、是非下記を受講してみてください。

Google Adsダッシュボード
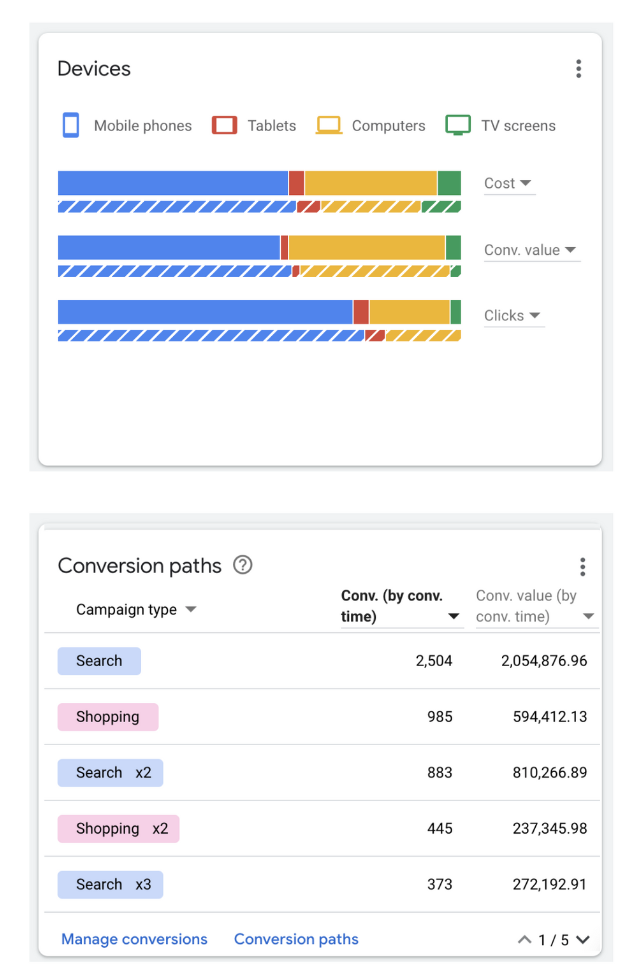
Google Adsの概要ページには、主要な広告指標を監視するための標準的なダッシュボードが用意されています。また、追加のダッシュボードを作成することもできます。新しいダッシュボードには、スコアカード、レポートからのチャートや表、プロジェクトで他の人と共同作業をしている場合はメモを追加することができます。
Dashboard examples
以下のリンクをクリックすると、Data Studioレポートギャラリーでダッシュボードの例を見ることができます。
- Account health: これらは、アカウントヘルスのダッシュボードの例で、アカウント全体のパフォーマンスや、検索、ディスプレイ、ビデオ、ショッピング、モバイルアプリのキャンペーンなど、個々のキャンペーンのパフォーマンスを表示することができます。
- Ad group performance: キャンペーン、キャンペーンタイプ、広告グループ、デバイスのパフォーマンス指標を表示するための選択可能なオプションを持つダッシュボードの例です。
- Performance by day: この例は、広告グループパフォーマンスダッシュボードの例と似ていますが、日ごとの指標を表示します。
- Insights by ad type: キャンペーン、広告グループ、デバイスのレスポンシブ検索広告と拡張テキスト広告のクリック数とクリックスルー率(CTR)を表示するための選択可能なオプションを備えたダッシュボードの一例です。
- Keyword performance: キャンペーン、マッチタイプ、広告グループ、デバイスのコンバージョン率やキーワードマッチを表示するオプションを選択可能なダッシュボードの例です。
Steps to create a dashboard
Google Ads で新しいダッシュボードを作成するには、次の手順を実行します。
- Sign in to your Google Ads account.
- Click the Reports icon.
- Select Dashboards.
- To create a new dashboard, click the plus icon.
スコアカード
スコアカードは、一般的にダッシュボード上で主要なパフォーマンス指標を視覚化するために使用されます。
Scorecard examples
以下は、「Overview」ページに表示されるスコアカードの例です。

Steps to add a scorecard to a dashboard
ダッシュボードにスコアカードを追加するには、次の手順を実行します。
- From the dashboard, click the plus icon.
- Click the Score card icon above the dashboard.
- Enter a name and description for the scorecard.
- Choose the measures you want to include.
- (Optional) Enter a filter you'd like to add to the data.
- (Optional) Add conditions for conditional formatting.
- (Optional) Customize the data shown in your scorecard by checking the boxes to include items like a Sparklines chart, percent change, and absolute change.
- Click Add.
レポート
内蔵の Report Editor を使用して表やグラフを作成し、その表やグラフをダッシュボードに追加することも可能です。
Steps to add a table or chart to a dashboard
- From the dashboard, click the plus icon.
- Click the Reports icon above the dashboard.
- Select Report and then select Create Report.
- Click Create Report and select Table to create a table or select the type of chart you want to create:
- Bar
- Column
- Time Series
- Pie
- Scatter
- Drag and drop a dimension into a labeled section. The dimension you select determines the metrics available in the next step.
- Drag and drop metrics, such as Clicks or Conversions, into a labeled section to include the data in the table or chart.
- Name your report, and click Save.
- (Optional) Enter a description for the report.
- Click Apply*.*