Prometheusでプロセス監視をやりたい
Prometheusを使う上で主流なのは各アプリ毎の専用のexporterを使うことみたい。
https://prometheus.io/docs/instrumenting/exporters/#miscellaneous
Third-party exportersに載ってたprocess-exporterを使います。
動作確認したいからローカルで実行する
準備
以下を準備する
- config
    - grafana
        - grafana.env(雛型として用意してるだけ)
    - process-exporter
        - config.yml
    - prometheus
        - prometheus.yml
    - fluentd-data
- docker-compose.yml
# [server]
# GF_SERVER_DOMAIN=localhost
# GF_SERVER_HTTP_PORT=3000
# GF_SERVER_PROTOCOL=http
process_names:
    - name: "{{.Comm}}"
      comm:
      - fluentd
global:
  scrape_interval:     15s
  evaluation_interval: 15s
  external_labels:
      monitor: 'codelab-monitor'

rule_files:
#   - "/var/app/prometheus/alert.rules"

scrape_configs:
  - job_name: 'prometheus'
    static_configs:
      - targets:
        - 'localhost:9090'

  - job_name: 'node-exporter'
    static_configs:
      - targets:
        - '[host or ip address]:9100'

  - job_name: 'process-exporter'
    static_configs:
      - targets:
        - '[host or ip address]:9256'
**[host or ip address]**は、自分のマシンに割り当てられているlocalhost以外のip addressやhostnameを指定します。
version: '3'
services:
  prometheus:
    image: prom/prometheus
    container_name: prometheus
    volumes:
      - ./config/prometheus/prometheus.yml:/etc/prometheus/prometheus.yml
    ports:
      - 9090:9090

  grafana:
    image: grafana/grafana
    container_name: grafana
    ports:
      - 3000:3000
    env_file:
      - ./config/grafana/grafana.env

  node-exporter:
    image: quay.io/prometheus/node-exporter
    container_name: node-exporter
    ports:
      - 9100:9100
    volumes:
      - /proc:/host/proc
      - /sys:/host/sys
      - /:/rootfs

  process-exporter:
    image: ncabatoff/process-exporter
    container_name: process-exporter
    ports:
        - 9256:9256
    volumes:
      - /proc:/host/proc
      - ./config/process-exporter:/config
    command: >
      --procfs /host/proc
      -config.path /config/config.yml

  fluentd:
    image: fluent/fluentd
    container_name: fluentd
    ports:
      - 24224:24224
    volumes:
      - ./fluentd-data:/fluentd/log
起動
$ docker-compose up -d
Prometheus-exporterの疎通確認
http://localhost:9090/targets にアクセスしてexporterのStateがUPになっているか確認

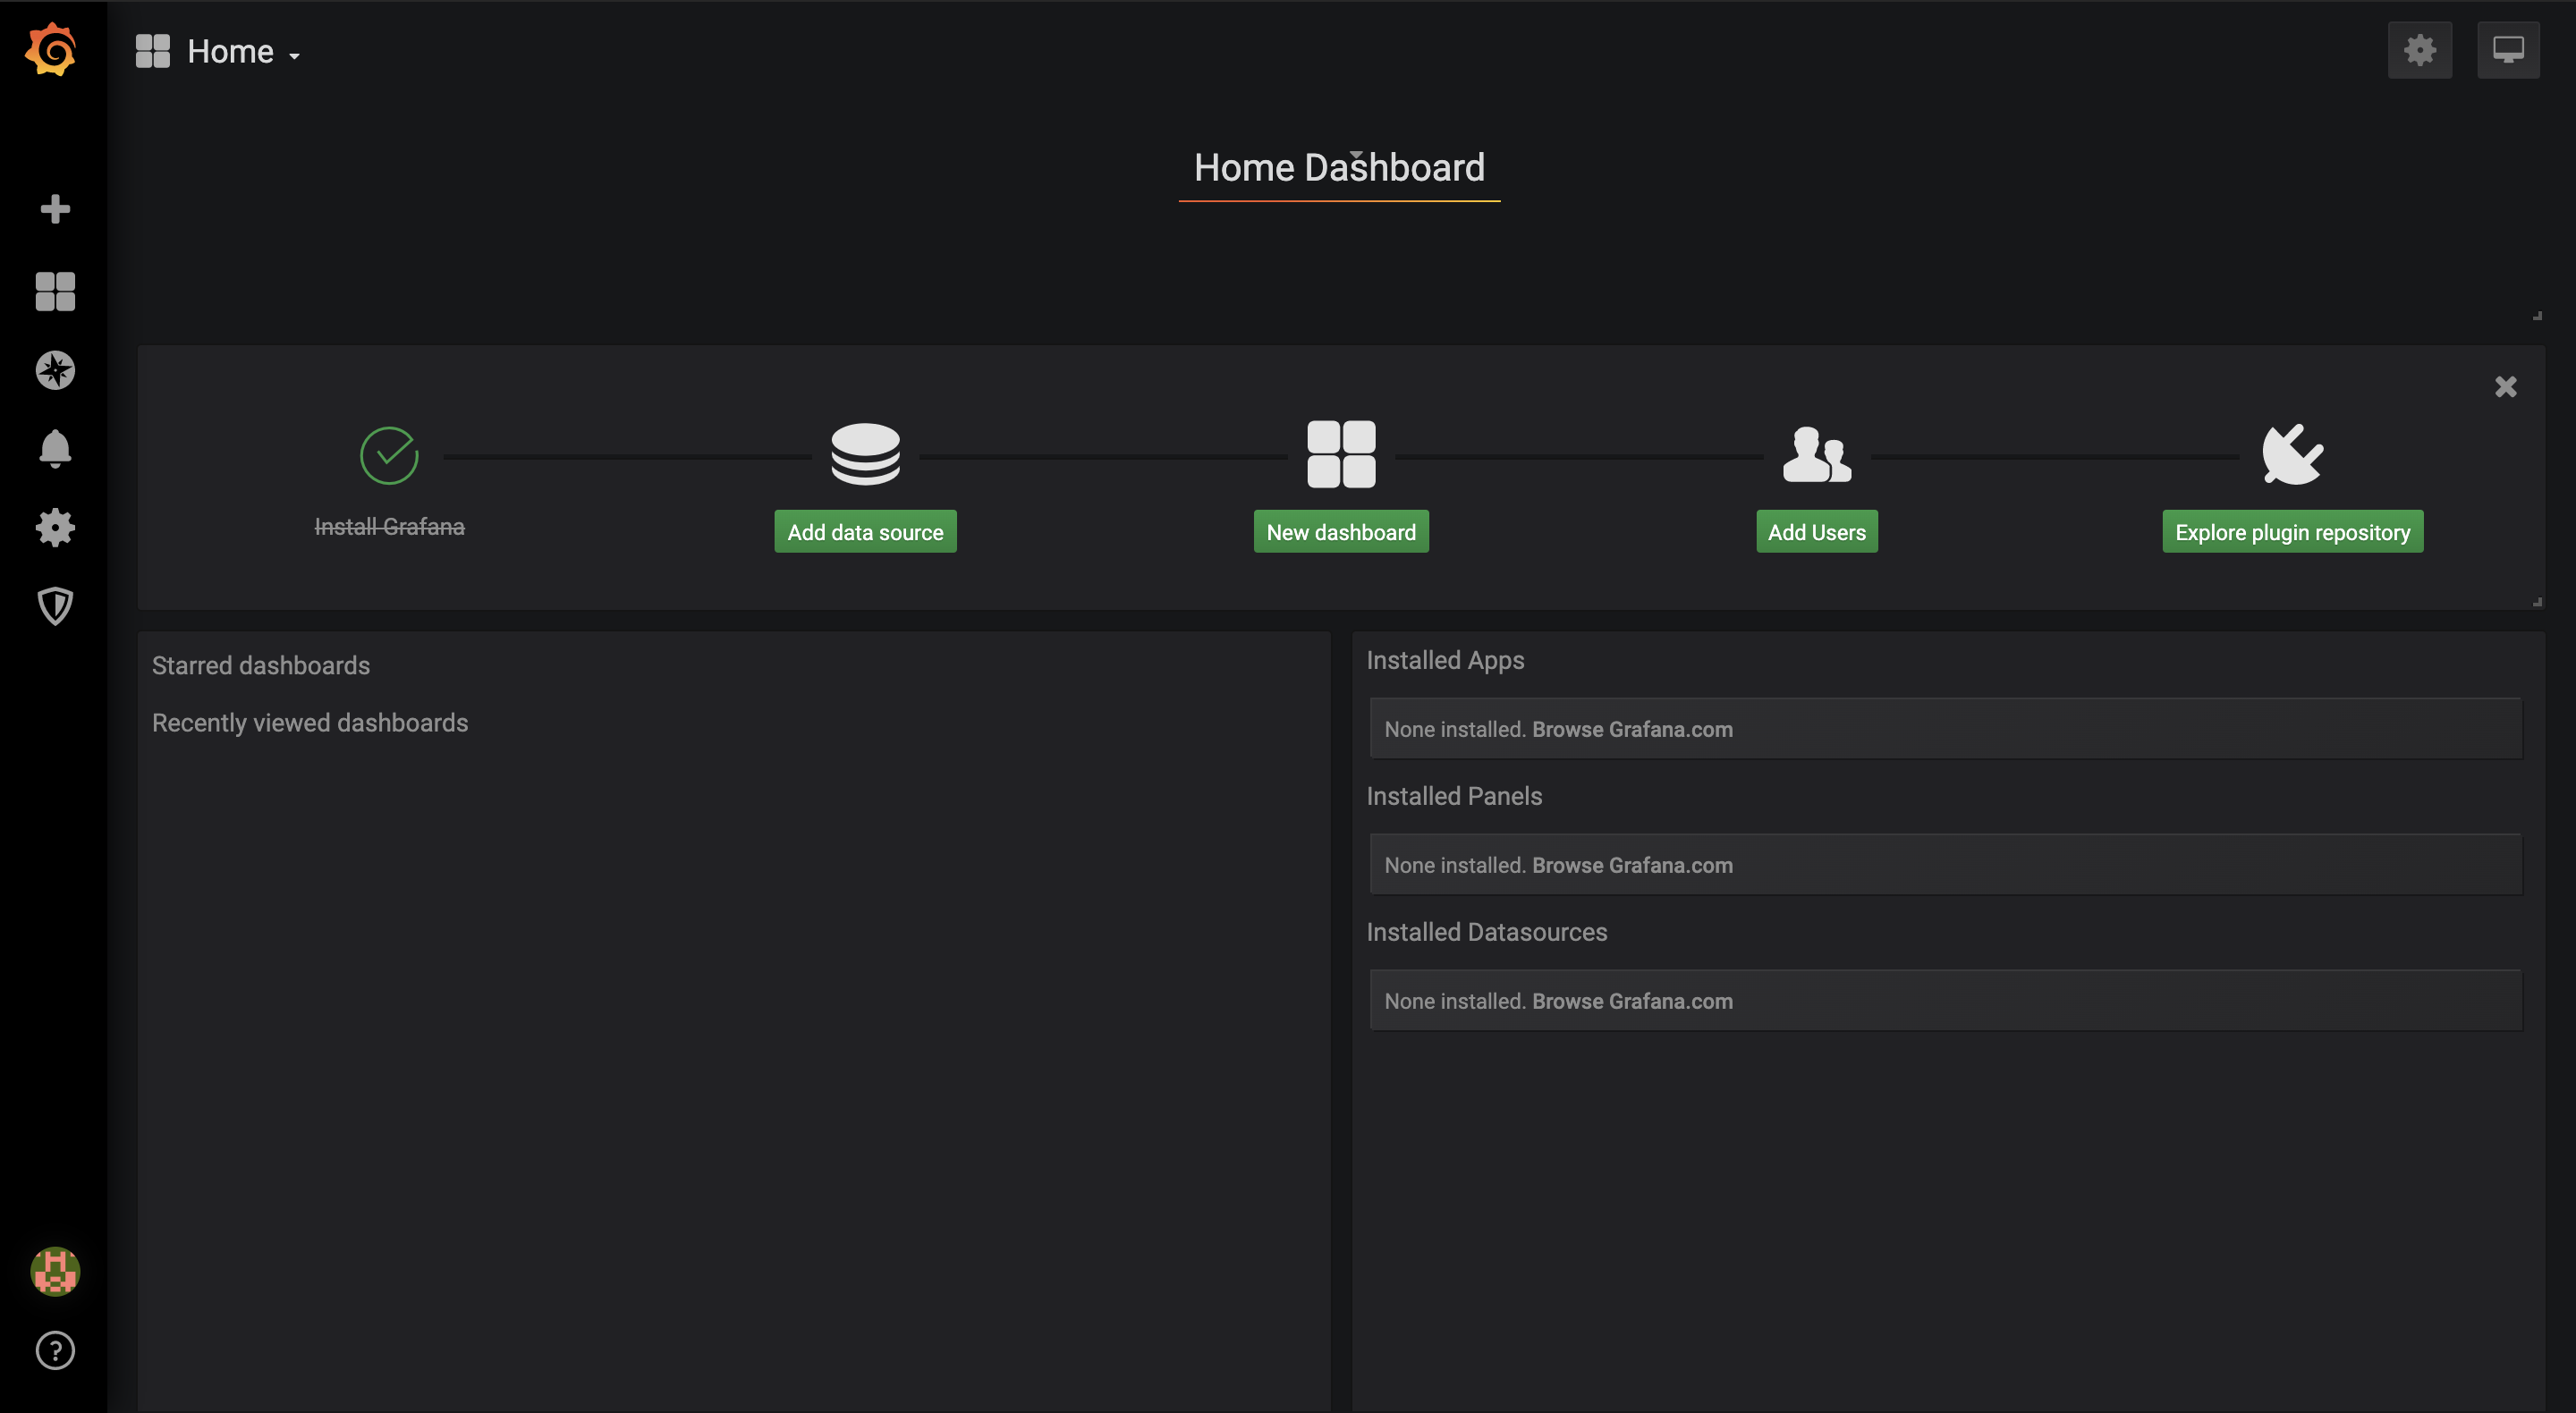
Grafana
Login

username : admin
password : admin
でログイン
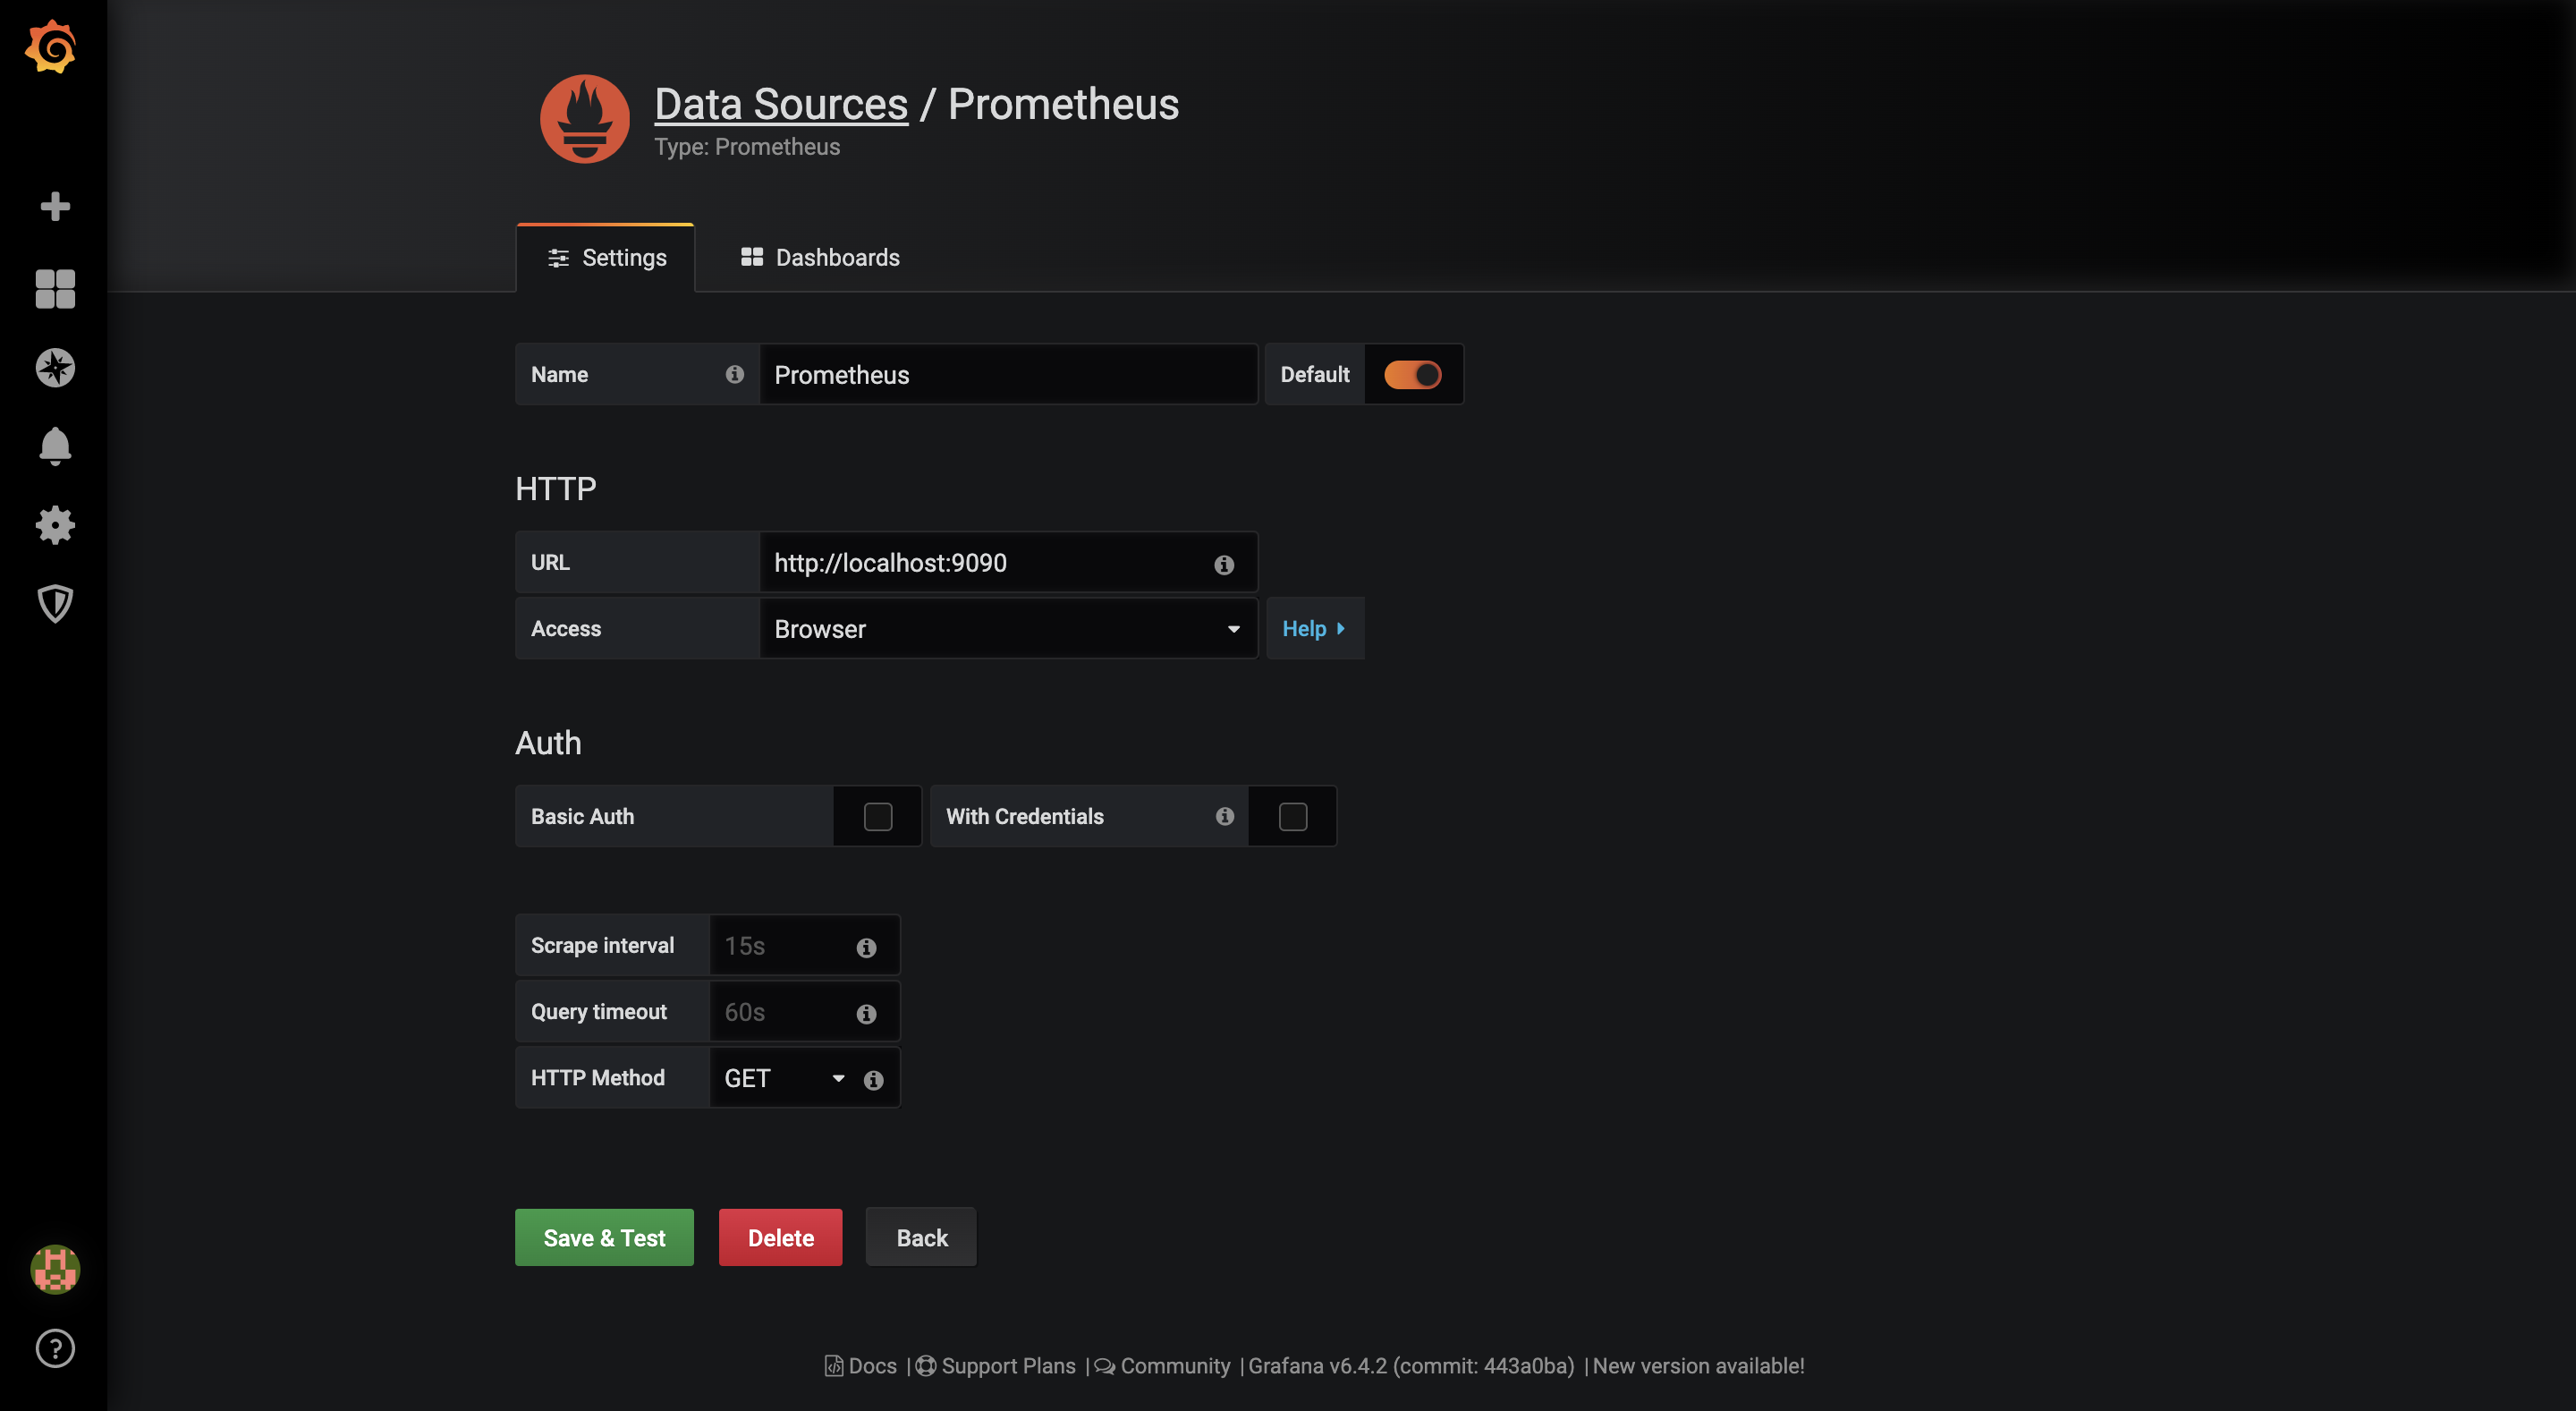
Add data source
Add data sourceをクリック
URL : http://localhost:9090
Access : Browser
にしてSave & Test
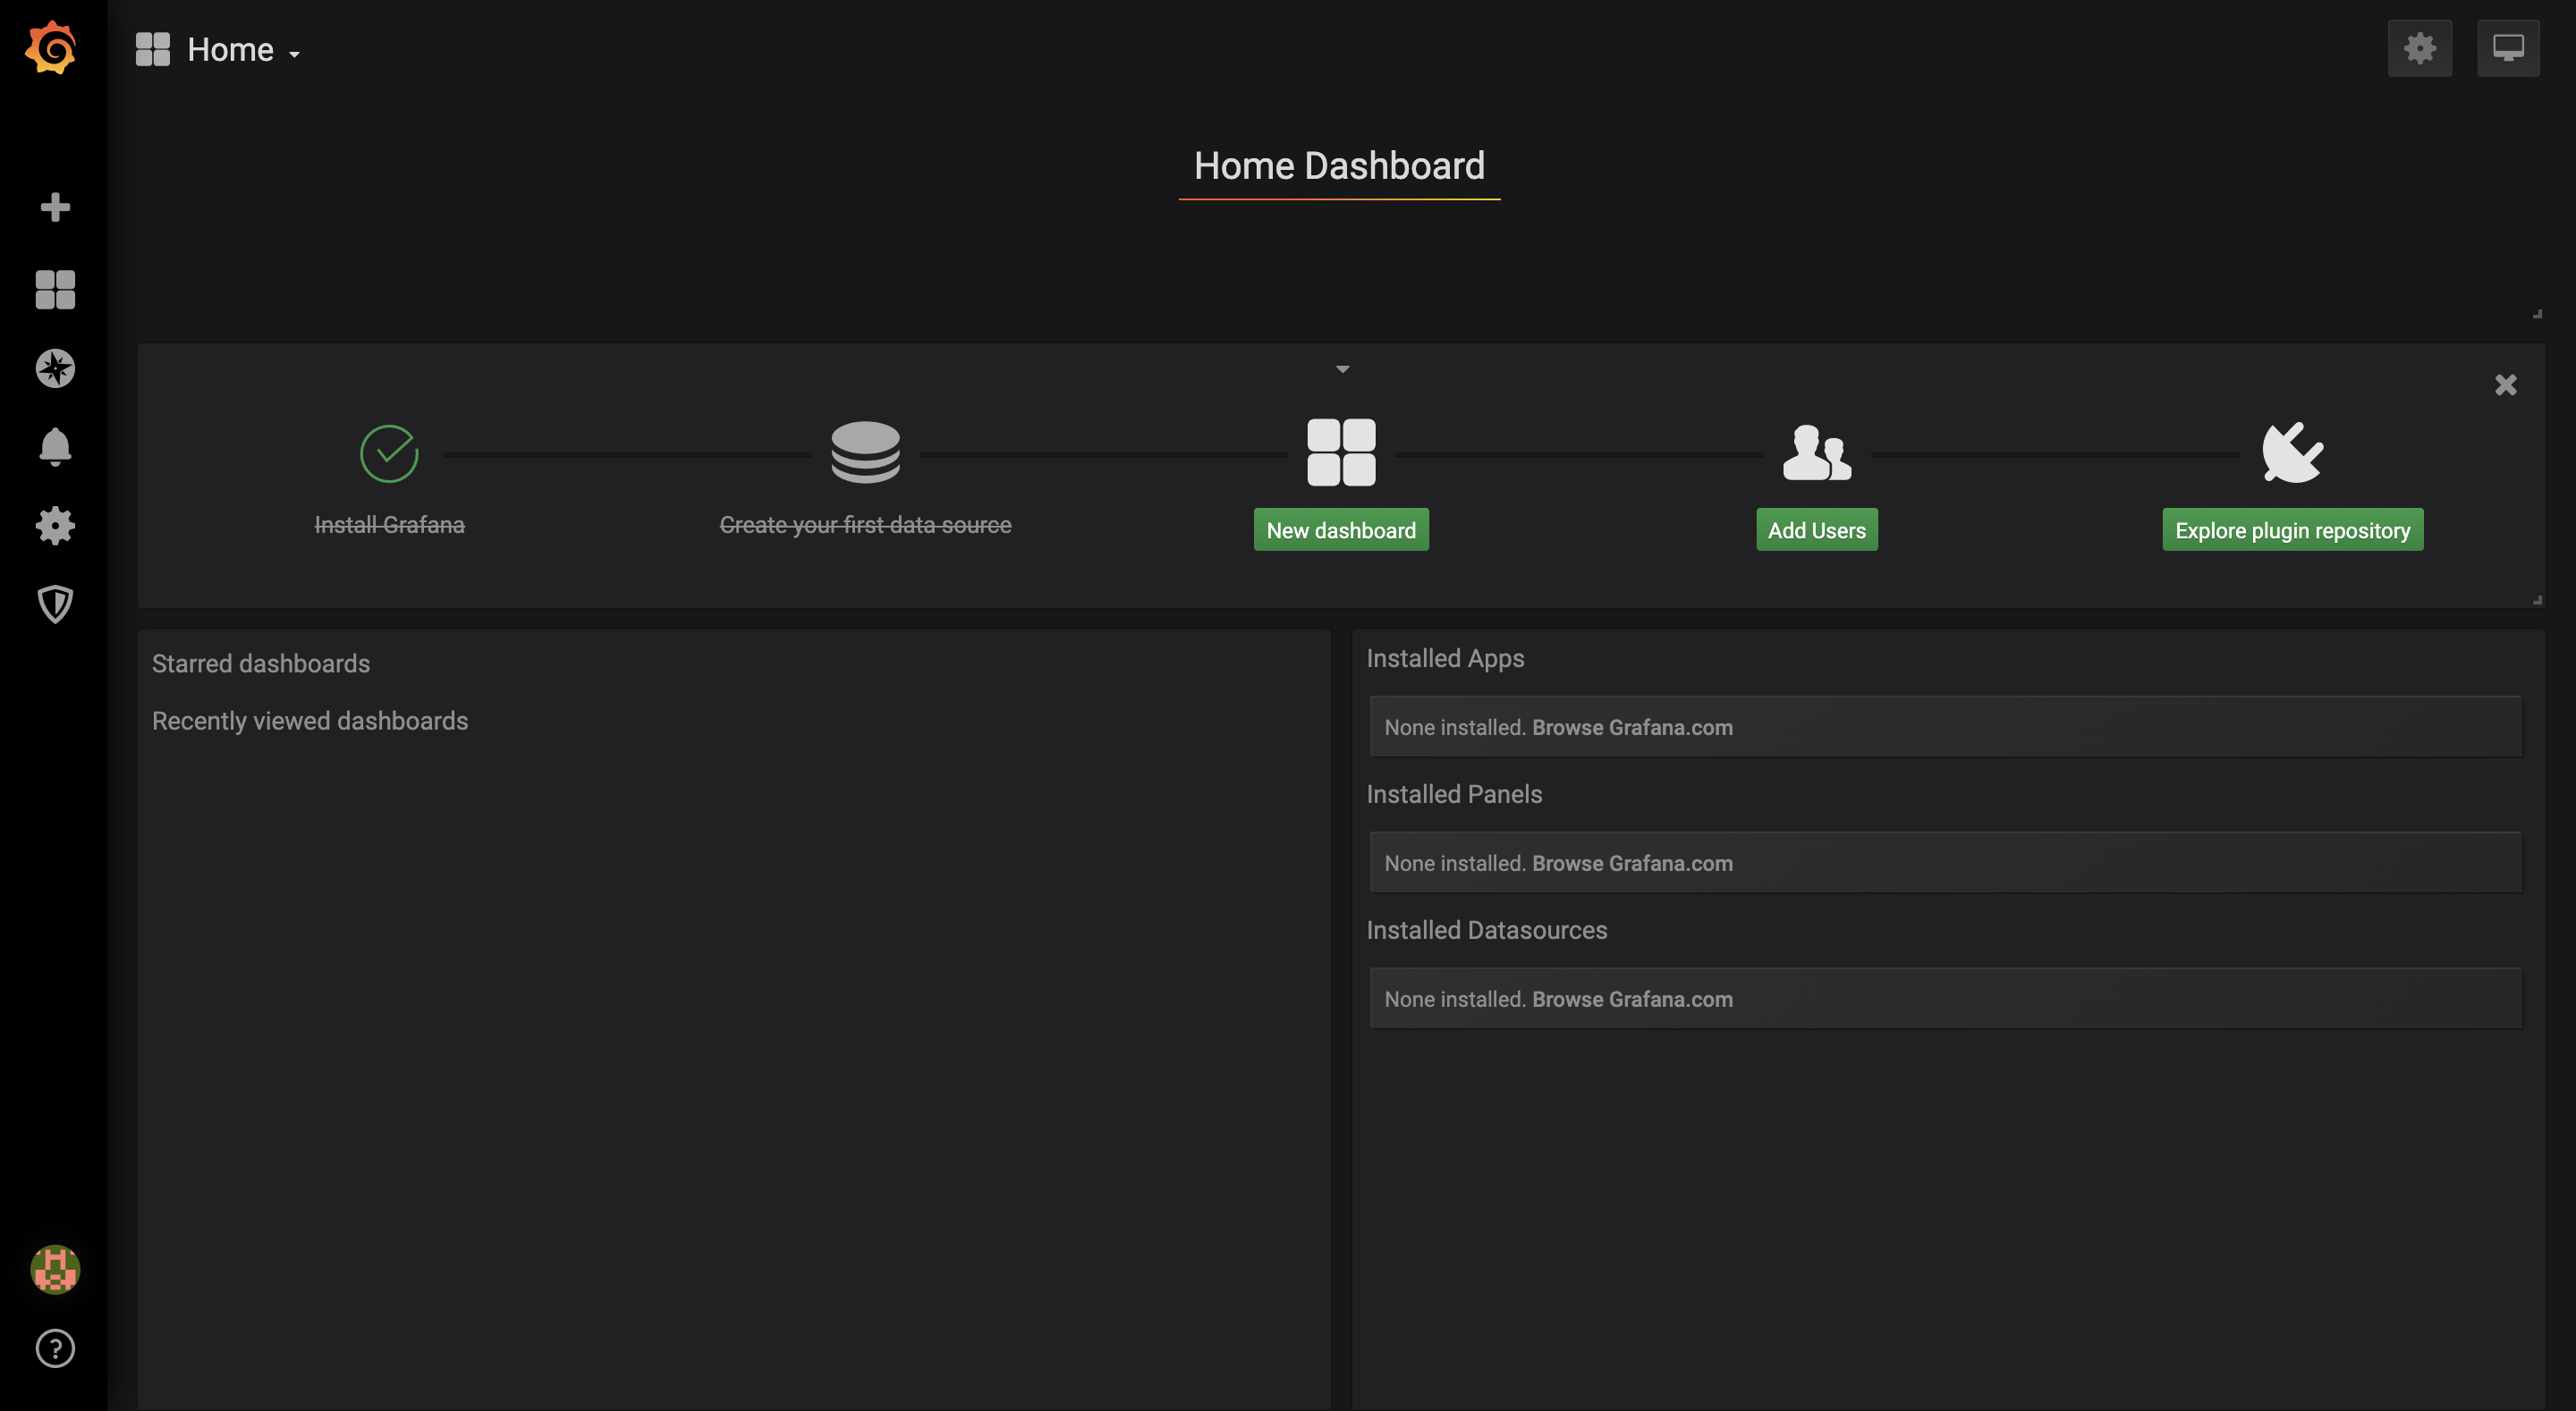
New dashboard
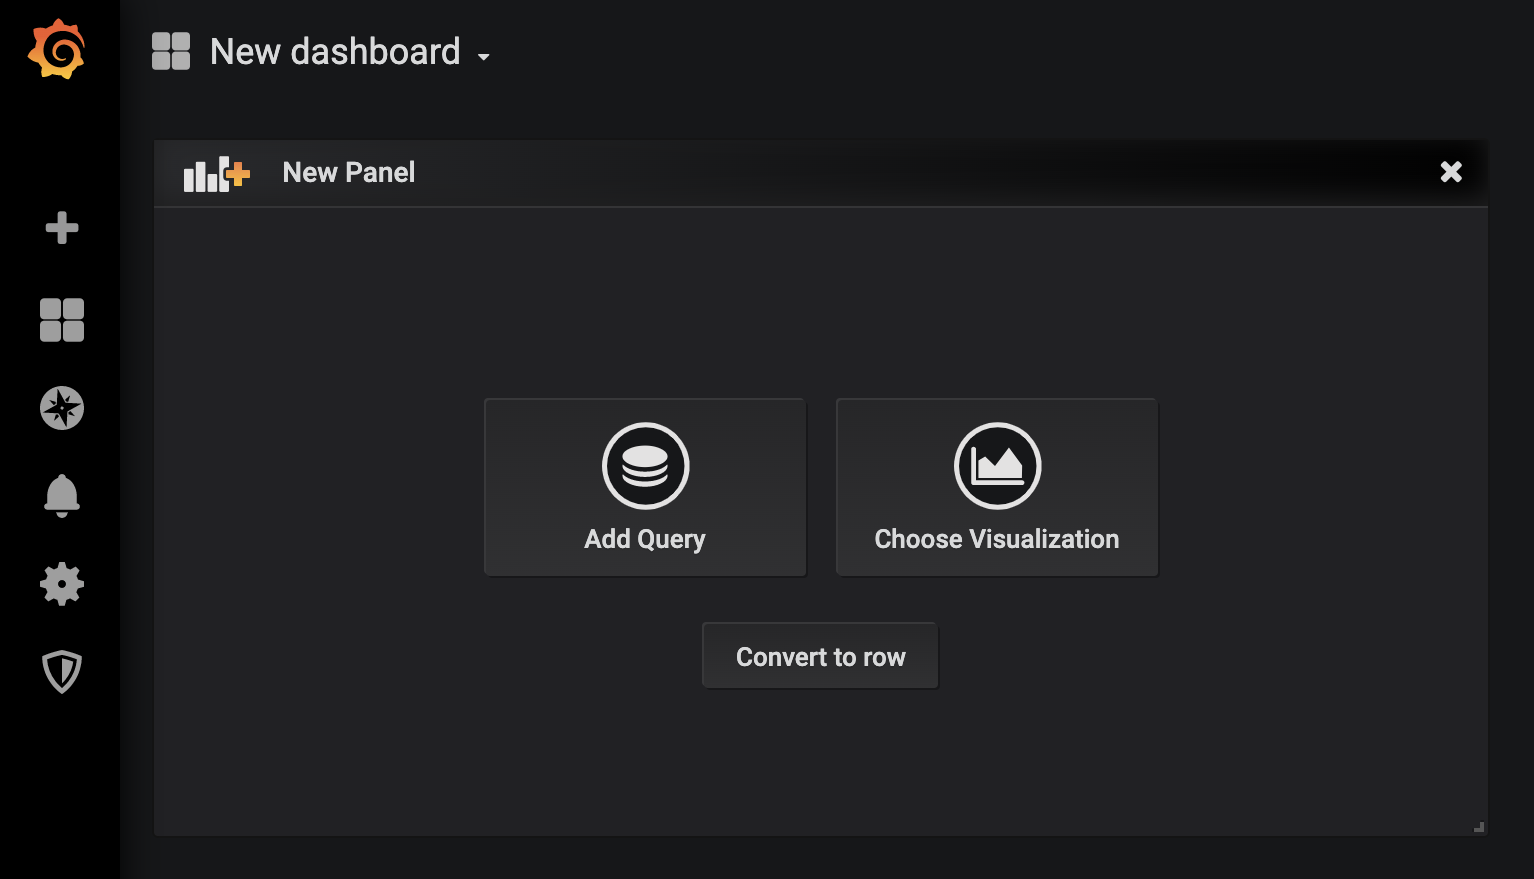
New dashboardをクリック
Add Queryをクリック
Metricsをnamedprocess_namegroup_procsにする。
プロセス数の監視はnamedprocess_namegroup_procsが基本だと思う。
Legendに{{groupname}}でプロセス名(グループ名)だけ表示する
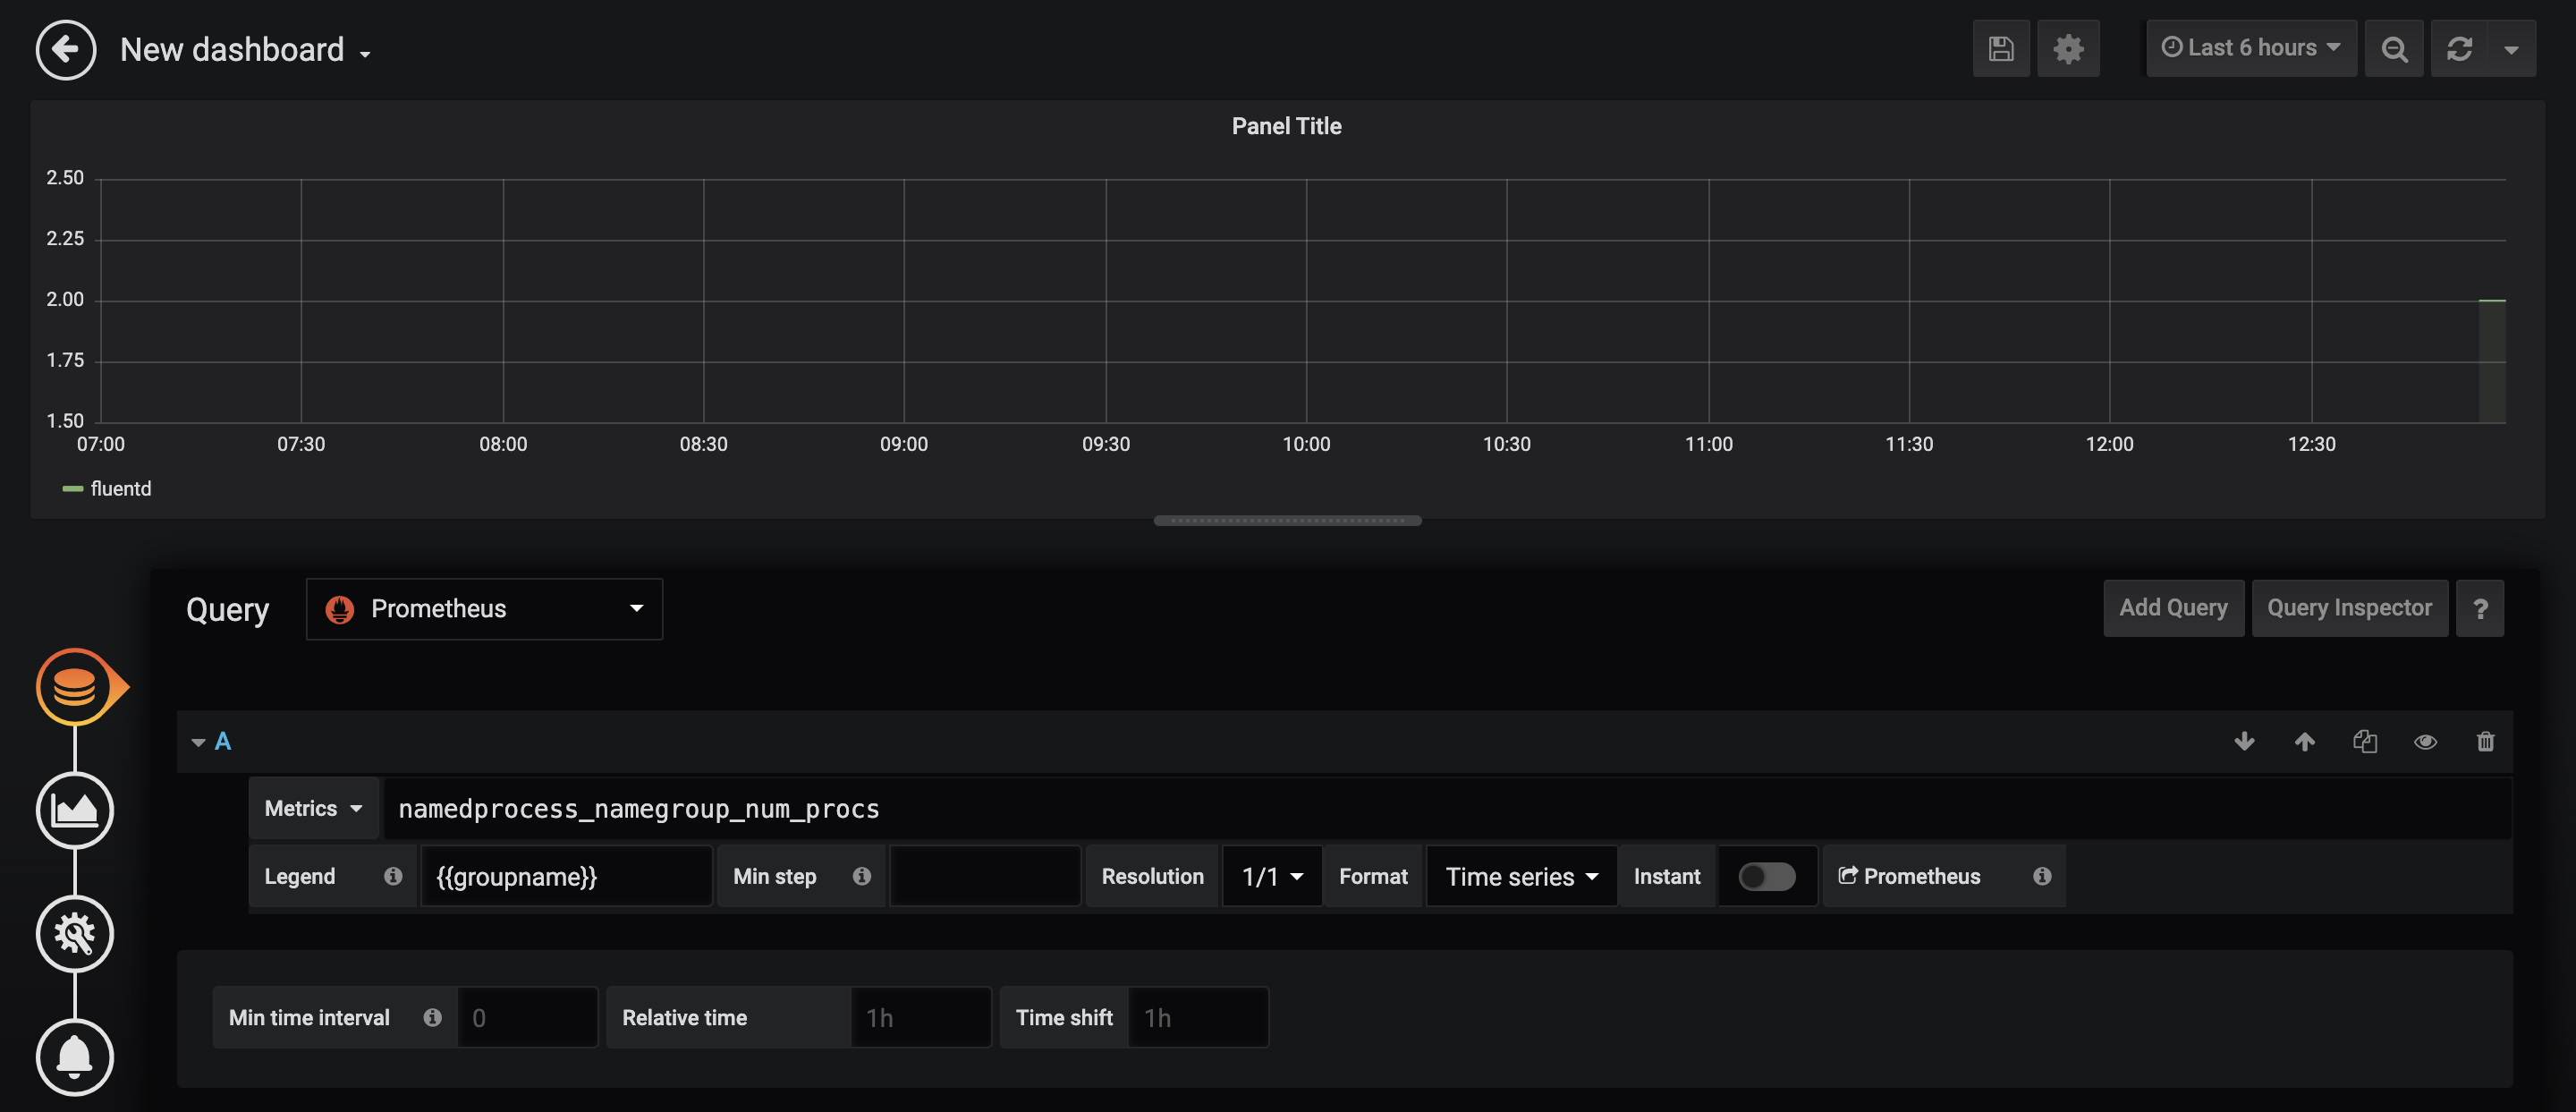
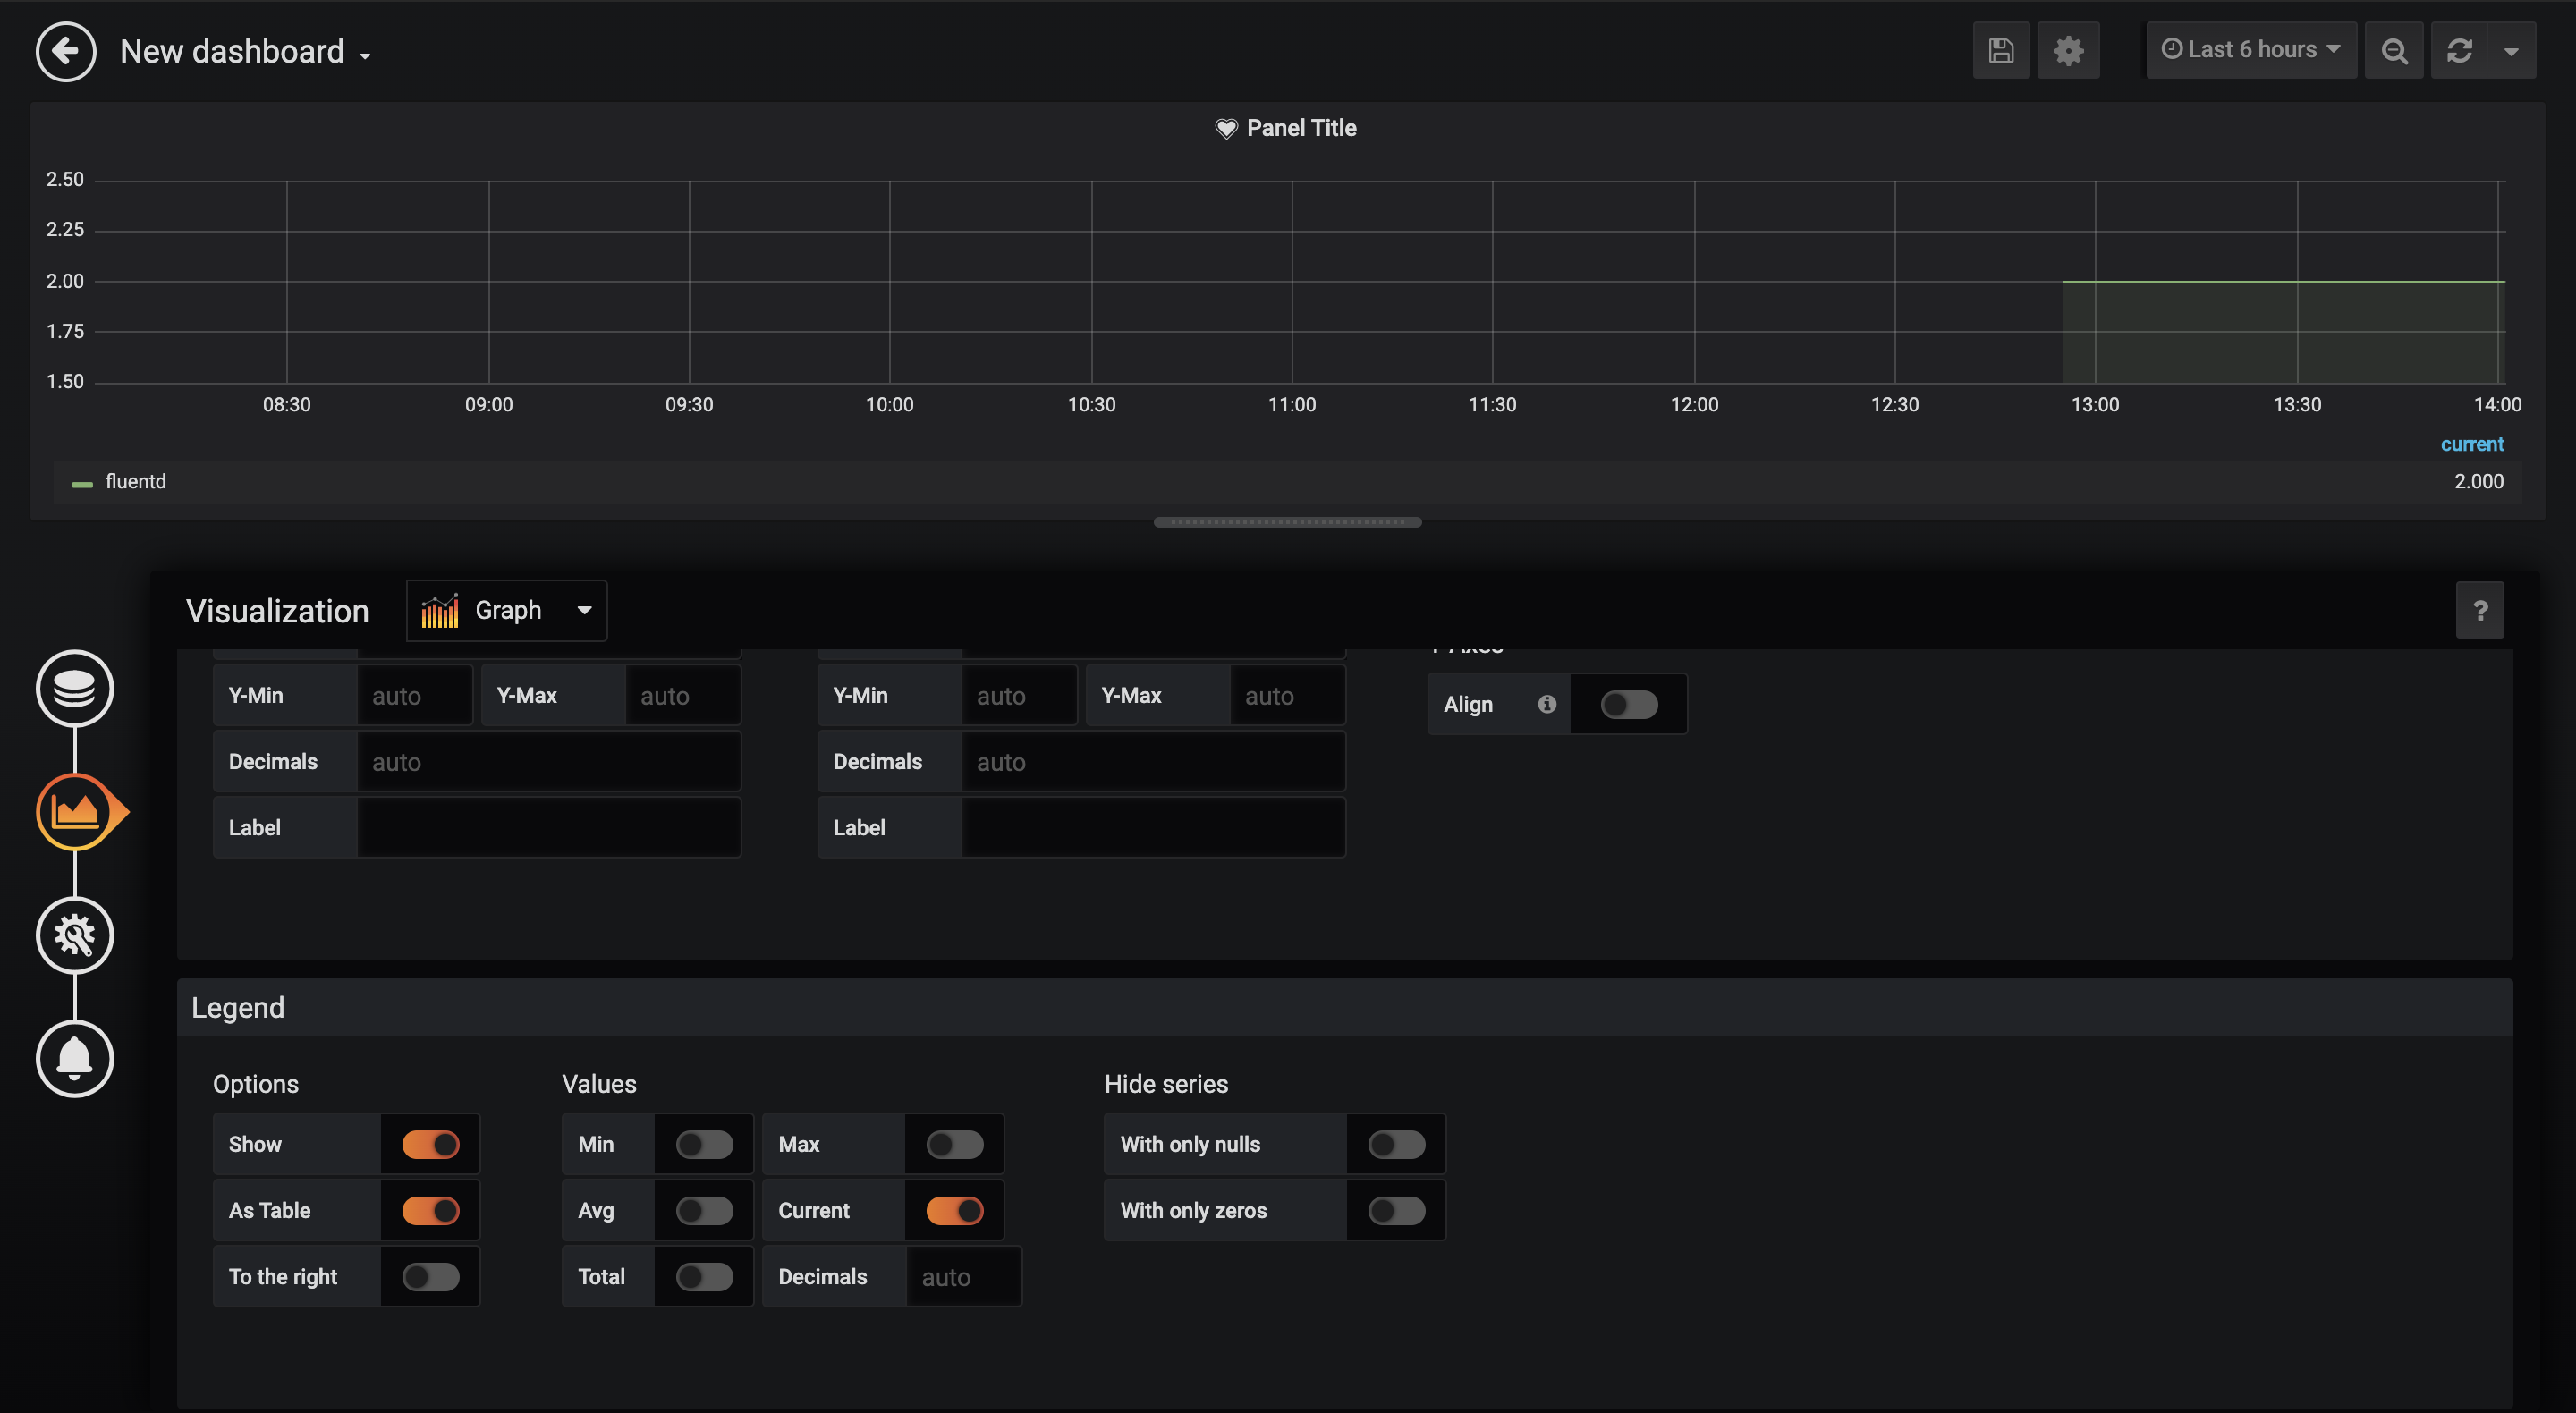
グラフは以下の様に設定してみた。
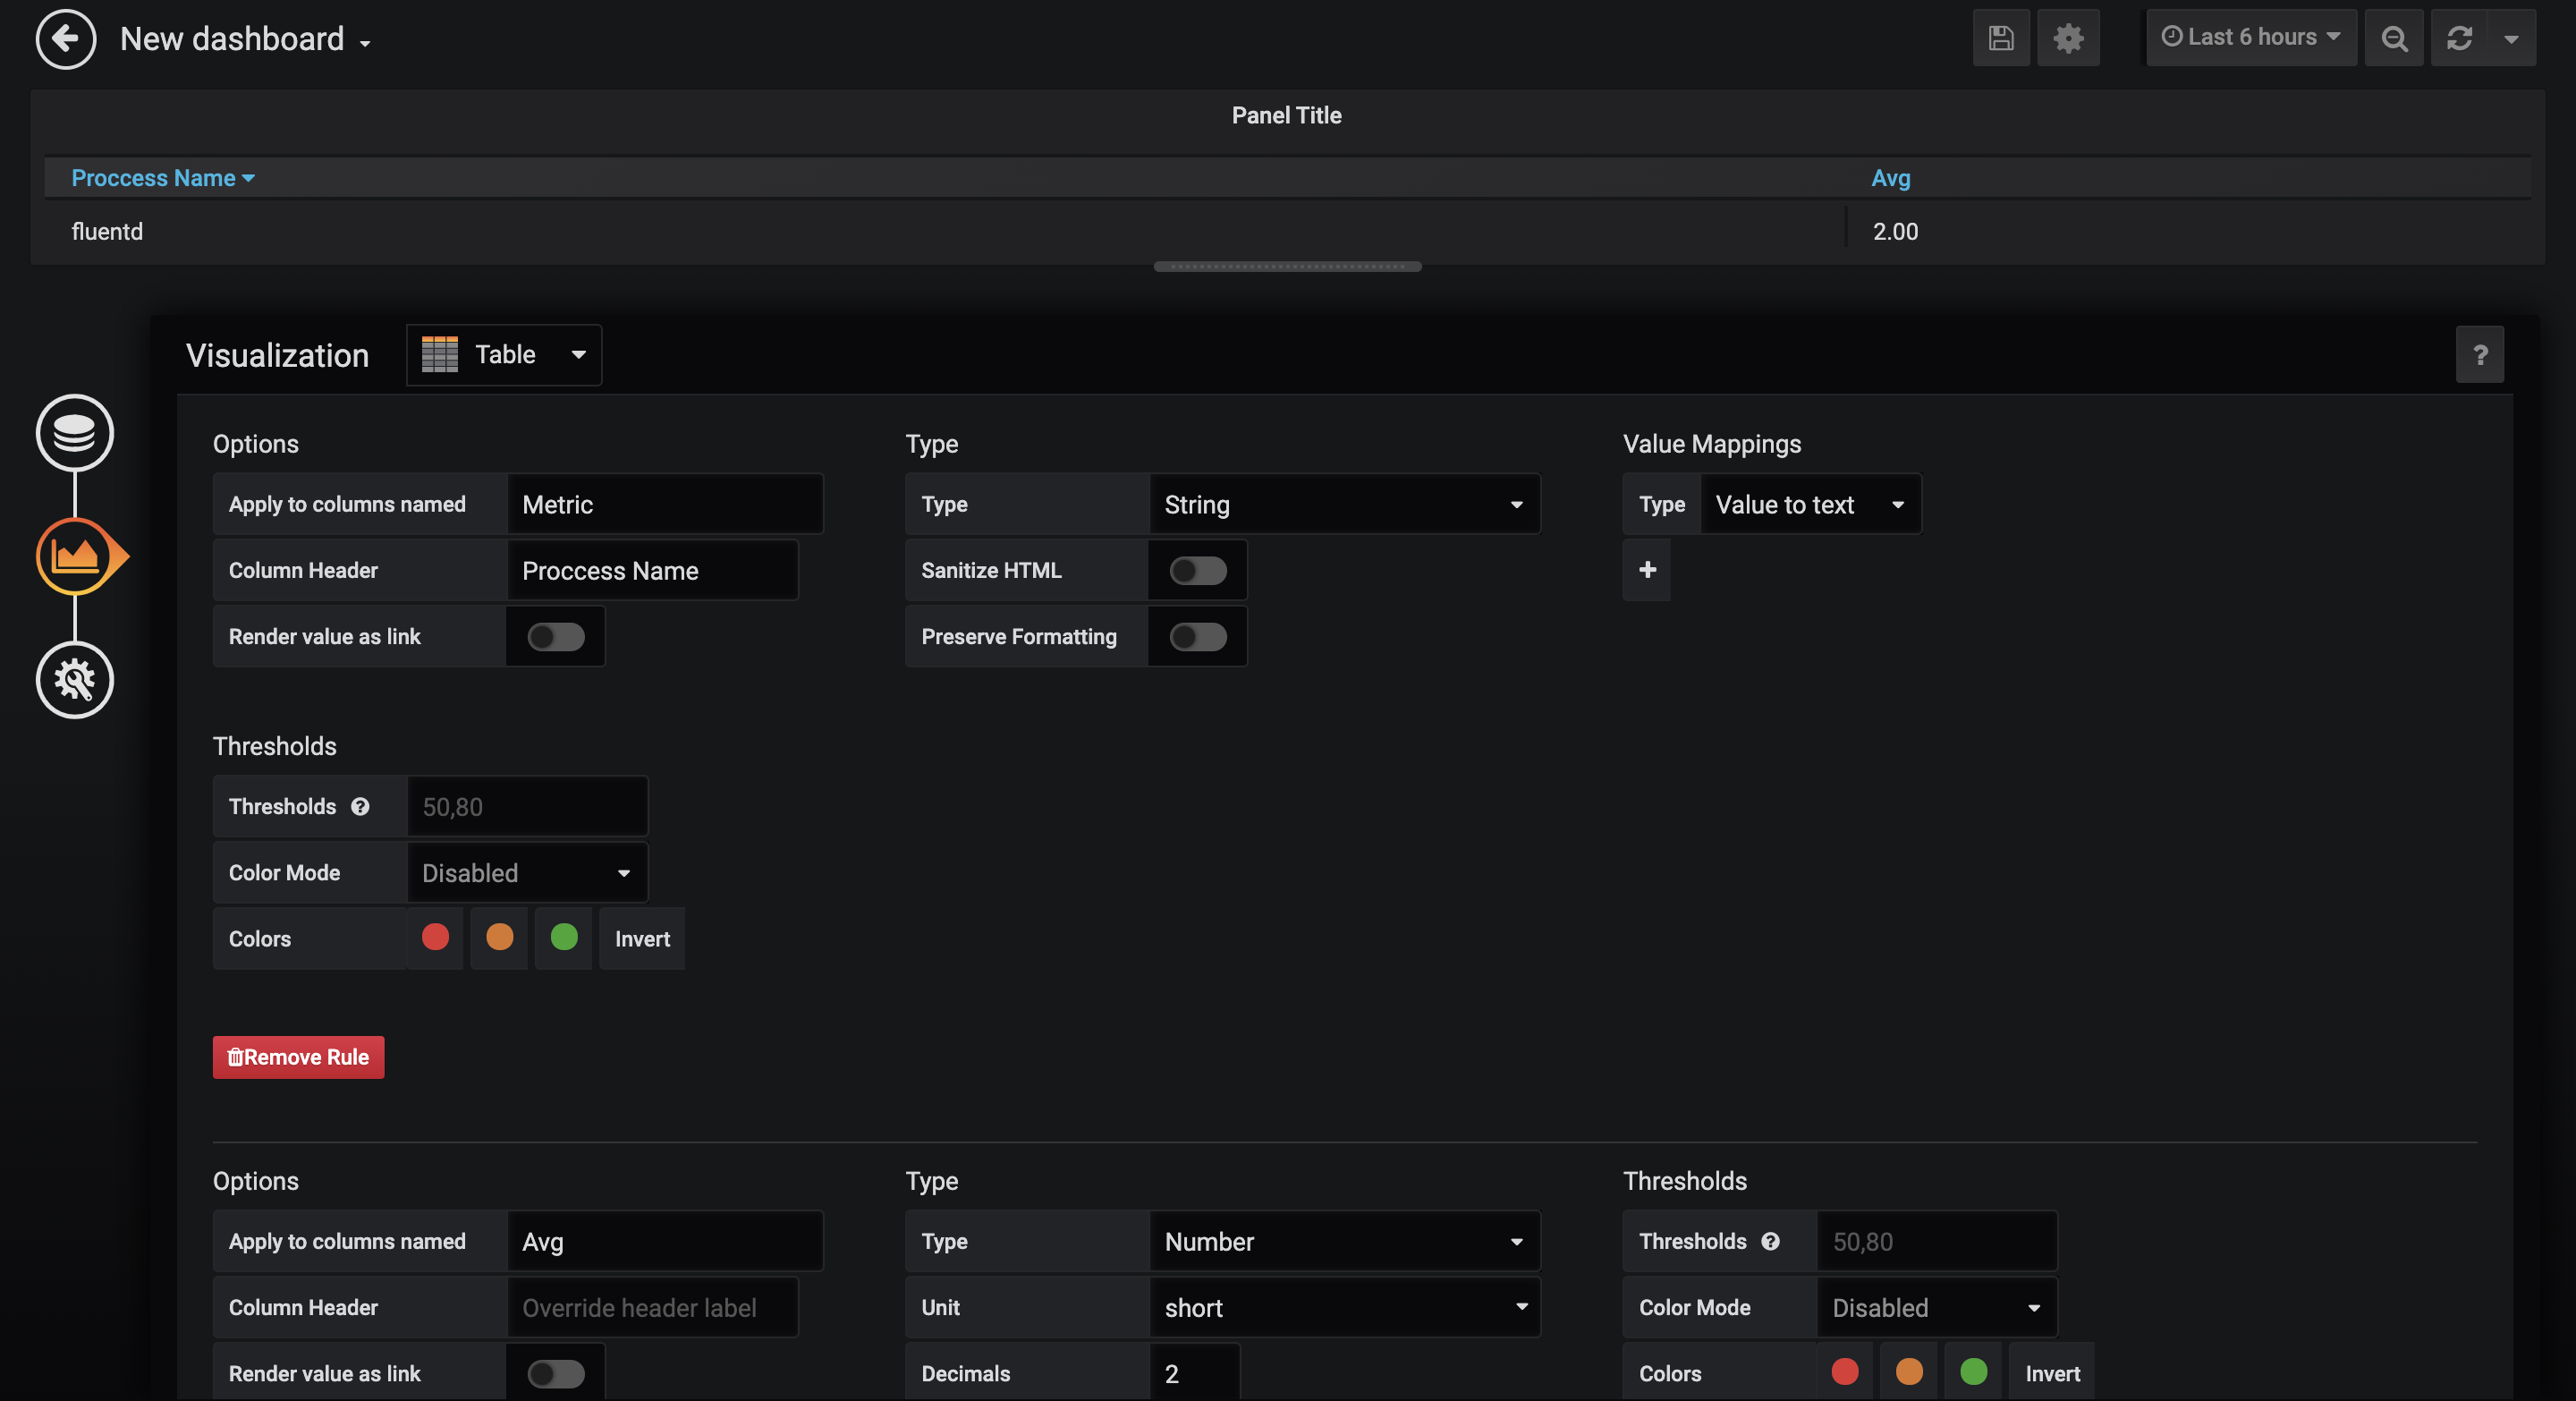
Table TransformはTime series aggregationsにする。
次にアラート用の新しいpanelを設定する。
Metricsは上で設定したのと同じ
アラート設定は以下

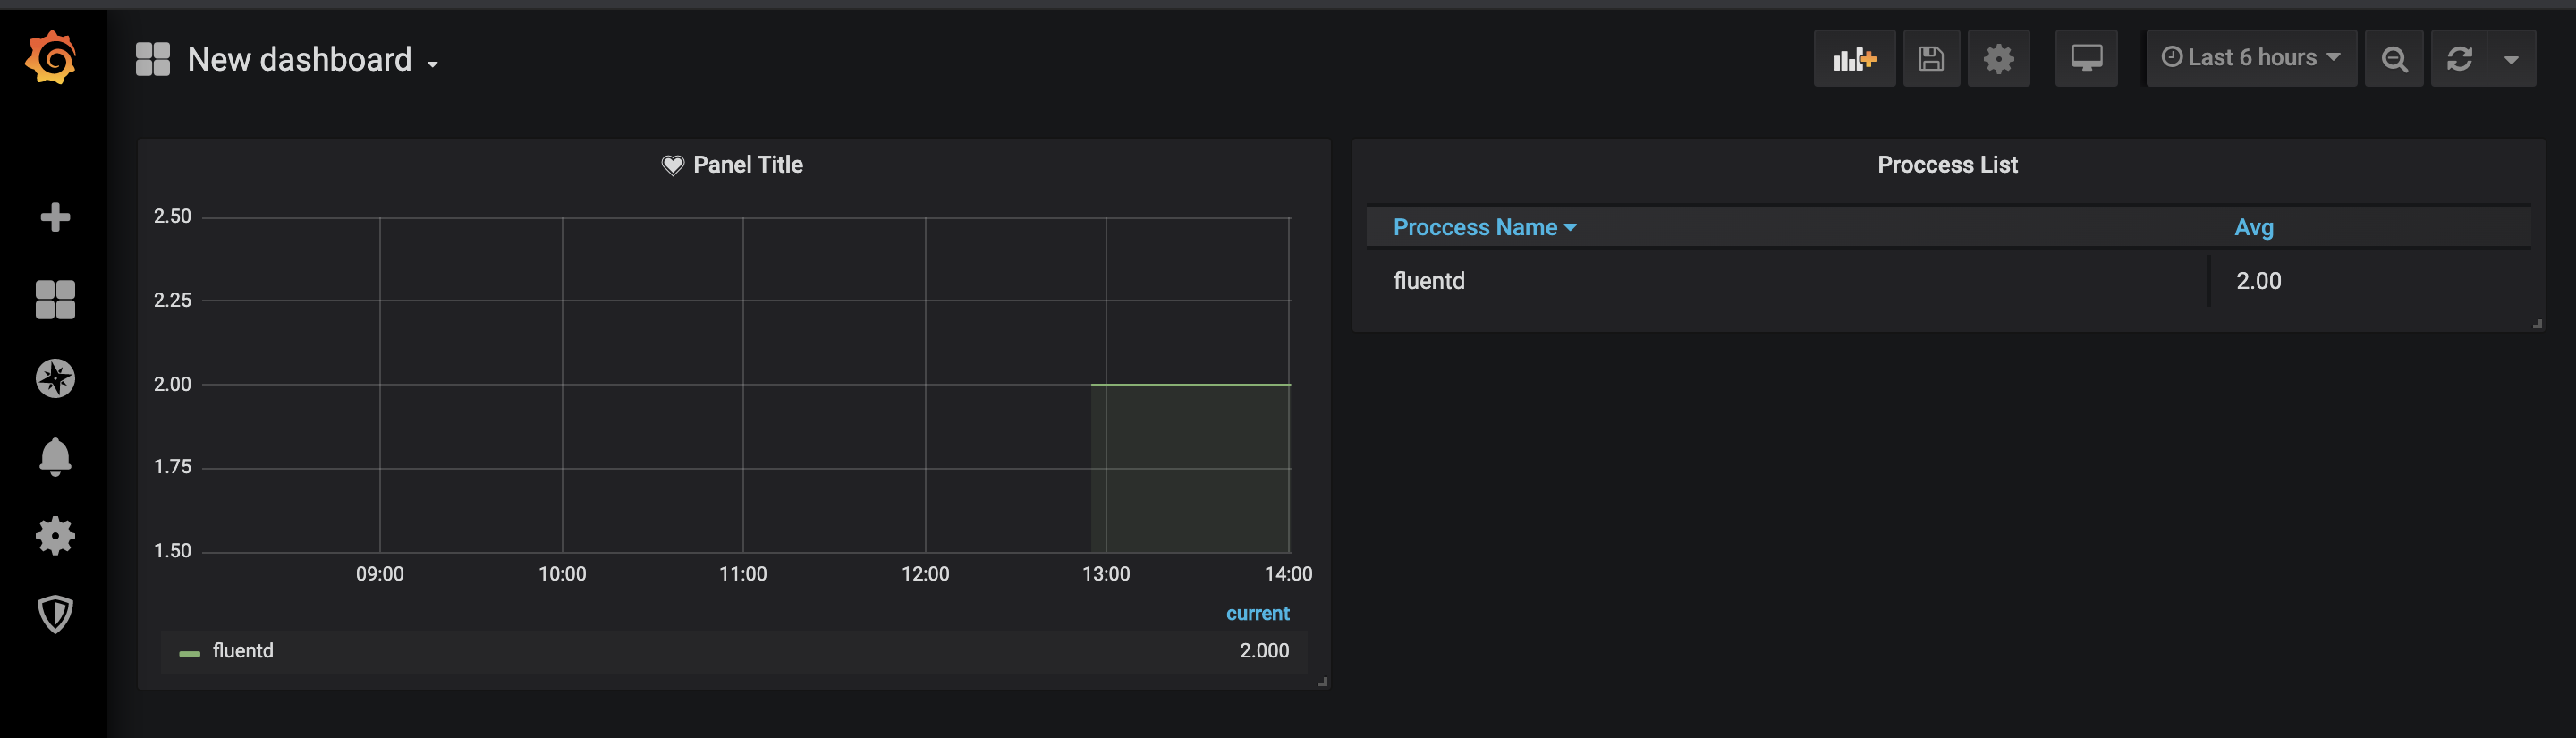
こんな感じになりました。
良い感じかな。
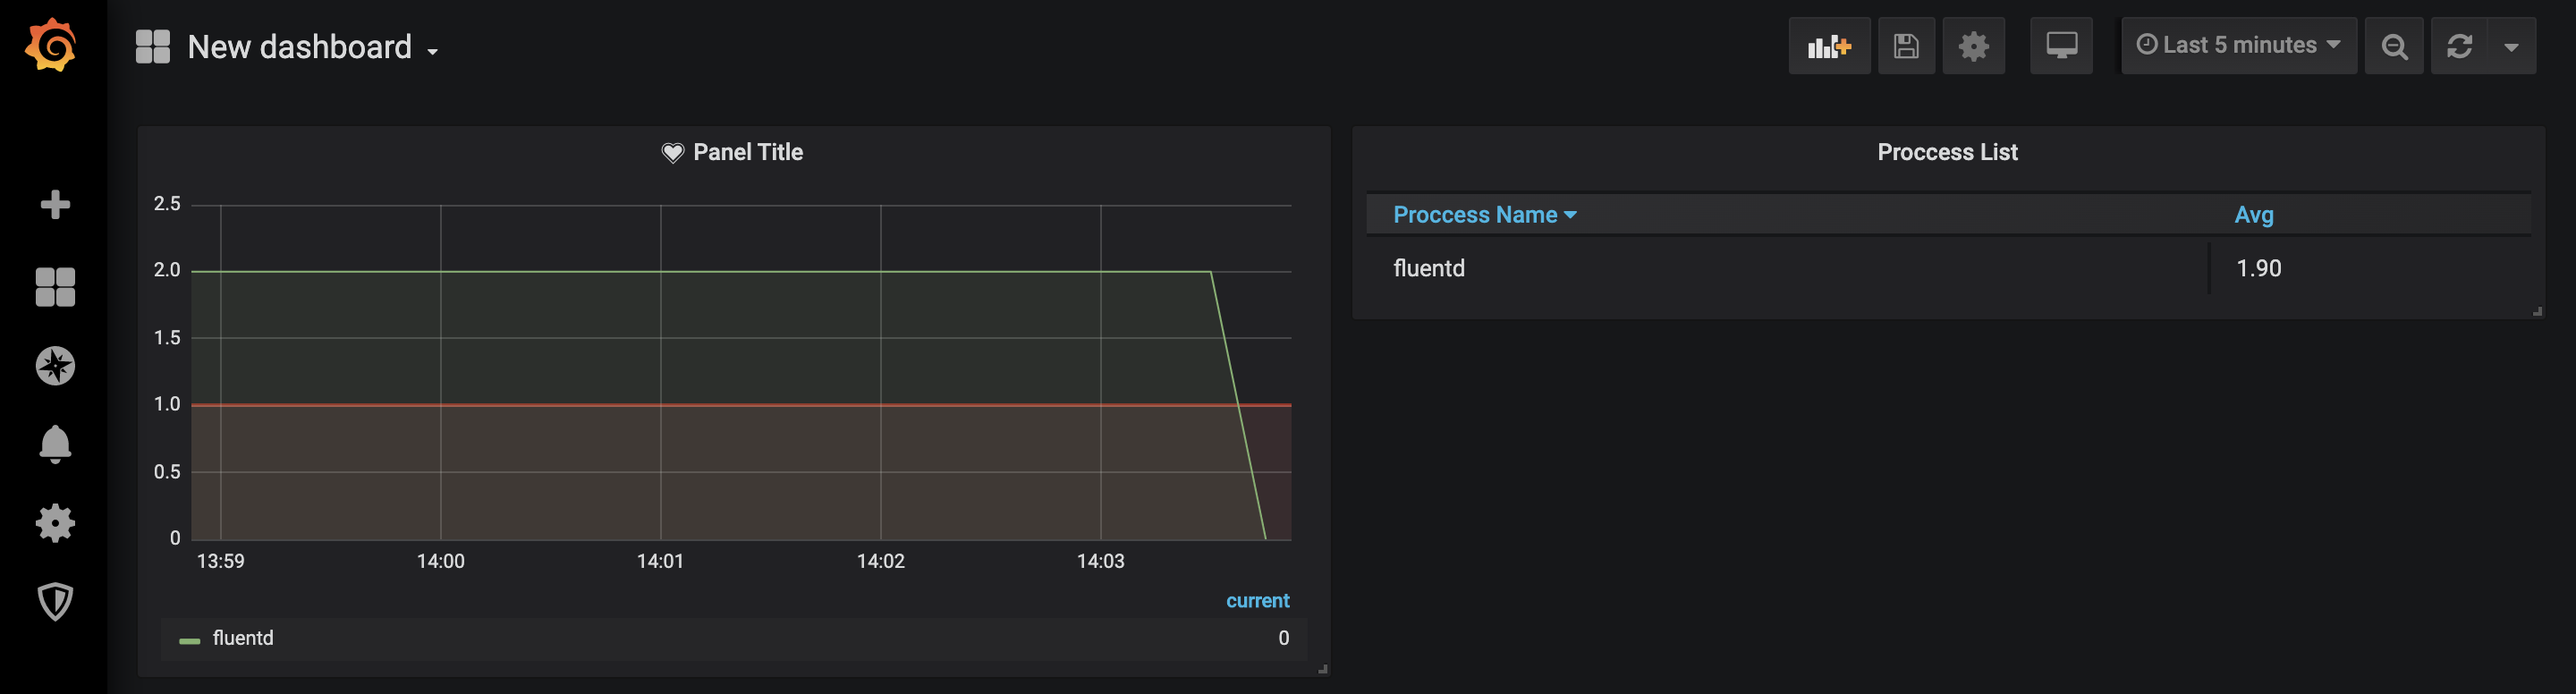
fluentdを止めてみる
$ docker stop fluentd
取れてる取れてる。
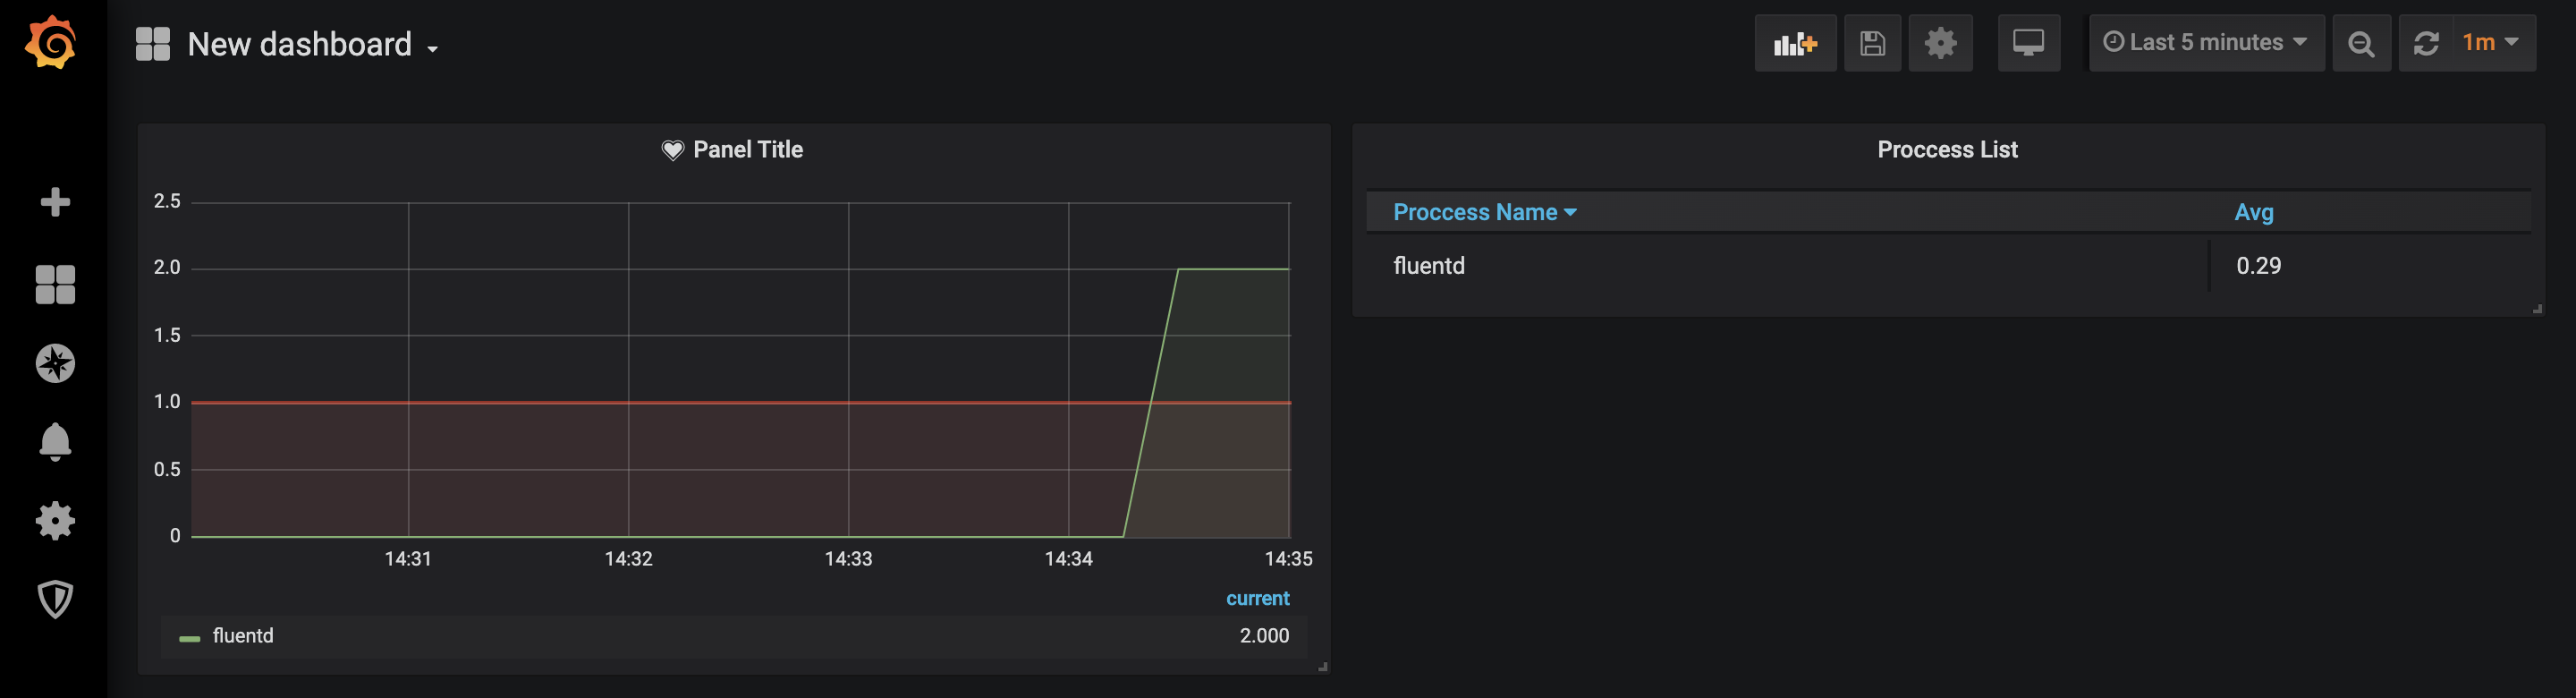
fluentdを起動しなおす
復帰した。
よきよき。
終わりに
とりあえずローカルで動かしてみたけどプロセスが死んだかどうかの確認とれるからいいかな?
アラートはGrafanaで設定してみたけど
実際はalertmanagerでやると思います。
Prometheusでプロセス監視をするのに良い方法があれば教えてください。
参考にしたサイト
【GitHub】
https://github.com/ncabatoff/process-exporter
【Prometheusのすすめ - プロセス監視 -】
https://qiita.com/nekoneck/items/a9deab623da277afc4be