ちょっとしたメモです。
ggplot2でgeom_bar()(棒グラフ)を使って作図する際に、その棒にそれぞれの件数を書き加える方法です。
件数を加えないで作図
普通に作成するとこうなります。
library(ggplot2)
data("mtcars")

ggplot(mtcars, aes(x = gear)) +
     geom_bar(stat = 'count')

効率的に件数を加える方法
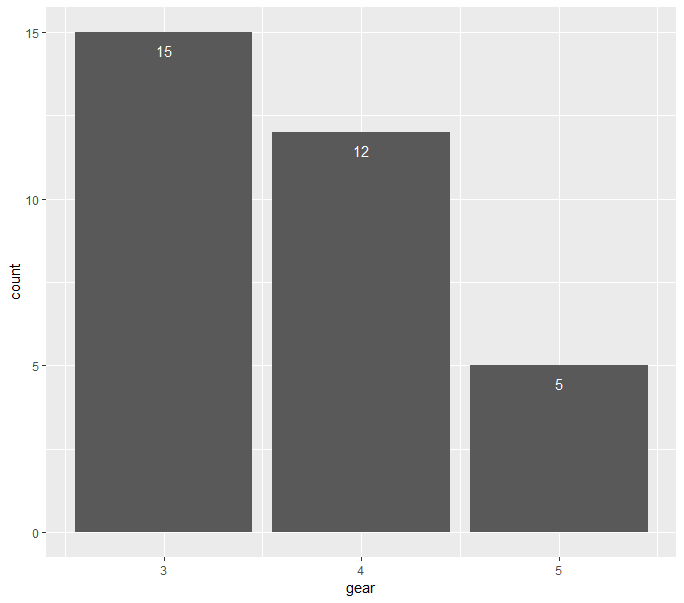
このグラフに、件数を加えるとこうなります。
ggplot(mtcars, aes(x = gear)) +
  geom_bar(stat = "count") +
  stat_count(aes(label = ..count..), geom = "text", vjust = 2, colour = "white")
この方法は、r-wakalang.slack.comにて、kazutanさんに教えていただきました。
いつも、お世話になってます!!
余談~非効率な方法で件数を加える~
上記、stat_count()を使わずに書くと、こんな風になります。
library(dplyr)

mtcars %>%
    group_by(gear) %>%
    summarise(cnt = n()) %>%
    ggplot(aes(x = gear, y = cnt)) +
    geom_bar(stat = 'identity') +
    geom_text(aes(label = cnt), vjust = 2, colour = 'white')

出力結果は全く同じです。
非効率な方は、一度gear毎の件数を集計し、その集計結果を元に作図しているので、ひと手間加えていることになります。
こんなデータを一度作成しています
mtcars %>%
     group_by(gear) %>%
     summarise(cnt = n()) %>%
     head()
# A tibble: 3 x 2
   gear   cnt
  <dbl> <int>
1     3    15
2     4    12
3     5     5
以上、小ネタでした。