#1.目的
M5StackシリーズのATOM LiteとInfluxDB、Node-RED、Grafanaが稼働するサーバとでIoTシステムを構築するセミナーを開催するために、ラズパイを設定する。
設定にあたり、Qiitaの@dzonesasakiさんのページを参考にしました。
#2.準備
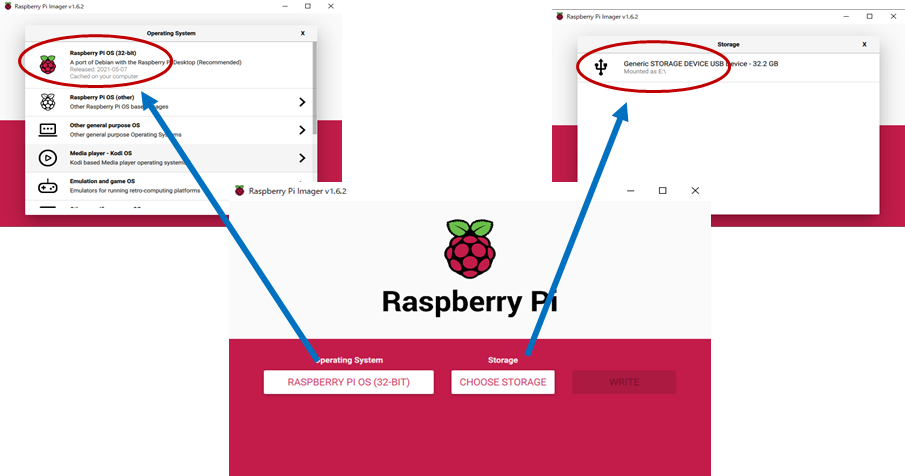
###(1)Raspberry Pi Imagerで、Raspberry Pi OS(32bit)版を32GBのマイクロSDメモリカードに焼きます。
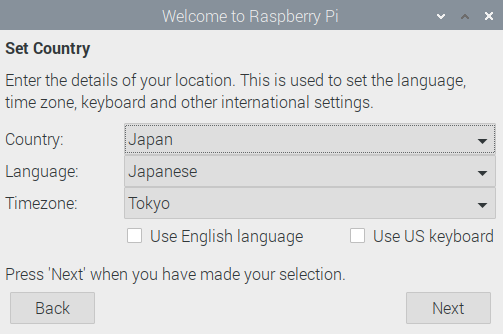
###(2)ラズパイにSDを入れて起動し、 設定を行います。
- 国を日本に (言語は日本語、タイムゾーンは東京)
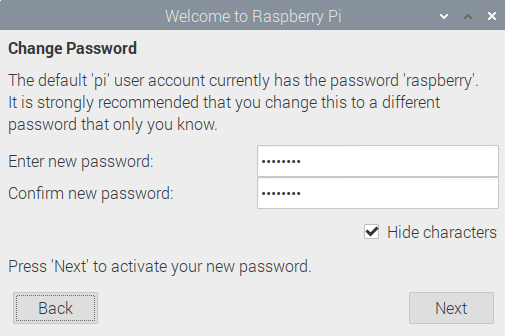
- Enter new password, Confirm new password 同じパスフレーズを入力
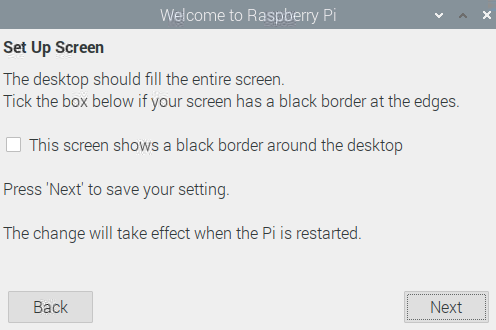
- ディスプレイ表示に余白がある場合は、this screen shows a black border...にチェック
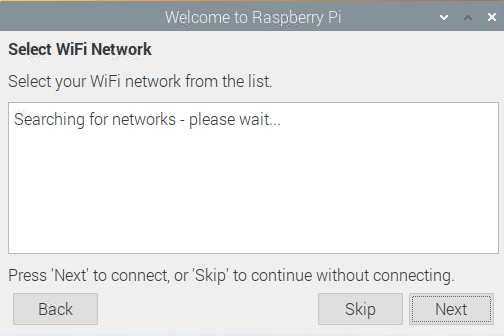
- Wi-Fiを接続
ethernetでインターネット接続している場合は、あえてWi-Fiに接続させる必要はないのでスキップする。
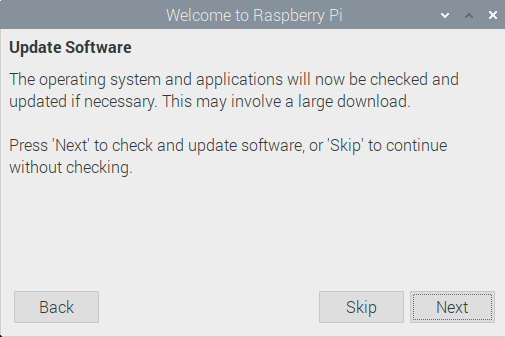
- アップデート
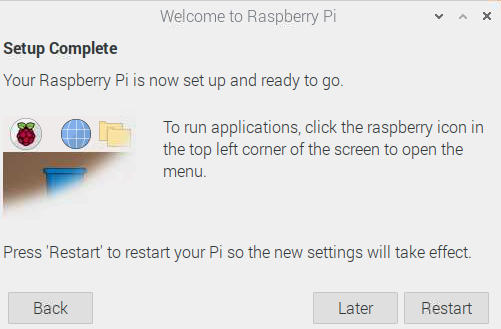
- 再起動
#3.研修に必要なソフトウェアのインストール
ターミナルを利用して必要なアプリをインストール。次のコマンドをコピーして、ターミナルにペーストして実行する。
sudo apt update && sudo apt upgrade -y && sudo apt autoremove -y && bash <(curl -sL https://raw.githubusercontent.com/node-red/linux-installers/master/deb/update-nodejs-and-nodered) && sudo systemctl enable nodered.service && cd ~/.node-red/ && npm install node-red-dashboard node-red-contrib-dht-sensor node-red-contrib-ds18b20-sensor node-red-contrib-influxdb node-red-contrib-aedes node-red-contrib-calc && sudo systemctl restart nodered.service && sudo apt install -y influxdb influxdb-client && influx -execute="create database IoTSeminar" && cd ~/Downloads && wget -q -O - https://packages.grafana.com/gpg.key | sudo apt-key add - && echo "deb https://packages.grafana.com/oss/deb stable main" | sudo tee -a /etc/apt/sources.list.d/grafana.list && sudo apt update && sudo apt install -y grafana && sudo /bin/systemctl daemon-reload && sudo /bin/systemctl enable grafana-server && sudo /bin/systemctl start grafana-server && sudo grafana-cli plugins install aceiot-svg-panel && sudo grafana-cli plugins install ae3e-plotly-panel && sudo grafana-cli plugins install agenty-flowcharting-panel && sudo grafana-cli plugins install bessler-pictureit-panel && sudo grafana-cli plugins install briangann-datatable-panel && sudo grafana-cli plugins install farski-blendstat-panel && sudo grafana-cli plugins install flant-statusmap-panel && sudo grafana-cli plugins install grafana-clock-panel && sudo grafana-cli plugins install grafana-googlesheets-datasource && sudo grafana-cli plugins install grafana-piechart-panel && sudo grafana-cli plugins install grafana-polystat-panel && sudo grafana-cli plugins install isaozler-paretochart-panel && sudo grafana-cli plugins install jdbranham-diagram-panel && sudo grafana-cli plugins install larona-epict-panel && sudo grafana-cli plugins install macropower-analytics-panel && sudo grafana-cli plugins install marcusolsson-csv-datasource && sudo grafana-cli plugins install marcusolsson-hourly-heatmap-panel && sudo grafana-cli plugins install michaeldmoore-annunciator-panel && sudo grafana-cli plugins install michaeldmoore-multistat-panel && sudo grafana-cli plugins install mtanda-google-calendar-datasource && sudo grafana-cli plugins install mtanda-histogram-panel && sudo grafana-cli plugins install mxswat-separator-panel && sudo grafana-cli plugins install natel-plotly-panel && sudo grafana-cli plugins install neocat-cal-heatmap-panel && sudo grafana-cli plugins install novatec-sdg-panel && sudo grafana-cli plugins install petrslavotinek-carpetplot-panel && sudo grafana-cli plugins install pierosavi-imageit-panel && sudo grafana-cli plugins install savantly-heatmap-panel && sudo grafana-cli plugins install scadavis-synoptic-panel && sudo grafana-cli plugins install snuids-radar-panel && sudo grafana-cli plugins install snuids-trafficlights-panel && sudo grafana-cli plugins install speakyourcode-button-panel && sudo chown -R grafana:grafana /var/lib/grafana/plugins/ && sudo systemctl restart grafana-server.service && sudo apt install -y jfbterm fonts-takao
Node-REDのインストール中に以下の質問があるので、両方ともyを入力する。
Are you really sure you want to do this ? [y/N] ? y
Would you like to install the Pi-specific nodes ? [y/N] ? y
###上記で実行している内容を以下で説明する。
##3.1 ソフトウェアのアップデート
$ sudo apt update && sudo apt upgrade -y && sudo apt autoremove -y
##3.2 Node-REDのインストール
Node-REDのインストール及びノードの追加設定
$ bash <(curl -sL https://raw.githubusercontent.com/node-red/linux-installers/master/deb/update-nodejs-and-nodered) && sudo systemctl enable nodered.service && cd ~/.node-red/ && npm install node-red-dashboard node-red-contrib-dht-sensor node-red-contrib-ds18b20-sensor node-red-contrib-influxdb node-red-contrib-aedes node-red-contrib-calc && sudo systemctl restart nodered.service
##3.3 InfluxDBのインストール
InfluxDB、及びクライアントInfluxのインストール。データベースIoTSeminarを追加設定。
$ sudo apt install -y influxdb influxdb-client && influx -execute="create database IoTSeminar"
##3.4 Grafanaのインストール
Grafanaのインストール及び自動起動の設定。また、プラグインを32個インストールし、プラグインのユーザとグループ名をgrafanaに変更する。
$ cd ~/Downloads && wget -q -O - https://packages.grafana.com/gpg.key | sudo apt-key add - && echo "deb https://packages.grafana.com/oss/deb stable main" | sudo tee -a /etc/apt/sources.list.d/grafana.list && sudo apt update && sudo apt install -y grafana && sudo /bin/systemctl daemon-reload && sudo /bin/systemctl enable grafana-server && sudo /bin/systemctl start grafana-server && sudo grafana-cli plugins install aceiot-svg-panel && sudo grafana-cli plugins install ae3e-plotly-panel && sudo grafana-cli plugins install agenty-flowcharting-panel && sudo grafana-cli plugins install bessler-pictureit-panel && sudo grafana-cli plugins install briangann-datatable-panel && sudo grafana-cli plugins install farski-blendstat-panel && sudo grafana-cli plugins install flant-statusmap-panel && sudo grafana-cli plugins install grafana-clock-panel && sudo grafana-cli plugins install grafana-googlesheets-datasource && sudo grafana-cli plugins install grafana-piechart-panel && sudo grafana-cli plugins install grafana-polystat-panel && sudo grafana-cli plugins install isaozler-paretochart-panel && sudo grafana-cli plugins install jdbranham-diagram-panel && sudo grafana-cli plugins install larona-epict-panel && sudo grafana-cli plugins install macropower-analytics-panel && sudo grafana-cli plugins install marcusolsson-csv-datasource && sudo grafana-cli plugins install marcusolsson-hourly-heatmap-panel && sudo grafana-cli plugins install michaeldmoore-annunciator-panel && sudo grafana-cli plugins install michaeldmoore-multistat-panel && sudo grafana-cli plugins install mtanda-google-calendar-datasource && sudo grafana-cli plugins install mtanda-histogram-panel && sudo grafana-cli plugins install mxswat-separator-panel && sudo grafana-cli plugins install natel-plotly-panel && sudo grafana-cli plugins install neocat-cal-heatmap-panel && sudo grafana-cli plugins install novatec-sdg-panel && sudo grafana-cli plugins install petrslavotinek-carpetplot-panel && sudo grafana-cli plugins install pierosavi-imageit-panel && sudo grafana-cli plugins install savantly-heatmap-panel && sudo grafana-cli plugins install scadavis-synoptic-panel && sudo grafana-cli plugins install snuids-radar-panel && sudo grafana-cli plugins install snuids-trafficlights-panel && sudo grafana-cli plugins install speakyourcode-button-panel && sudo chown -R grafana:grafana /var/lib/grafana/plugins/ && sudo systemctl restart grafana-server.service
##3.5 日本語ターミナル及び日本語フォントのインストール
研修では必要ないが、raspiを再設定する時に必要となるのでインストールしておく。
$ sudo apt install -y jfbterm fonts-takao
#4.ネットワークの設定
- ラズパイを無線のアクセスポイントとして機能させることで、ATOM Lite、PCと通信できるようにする。
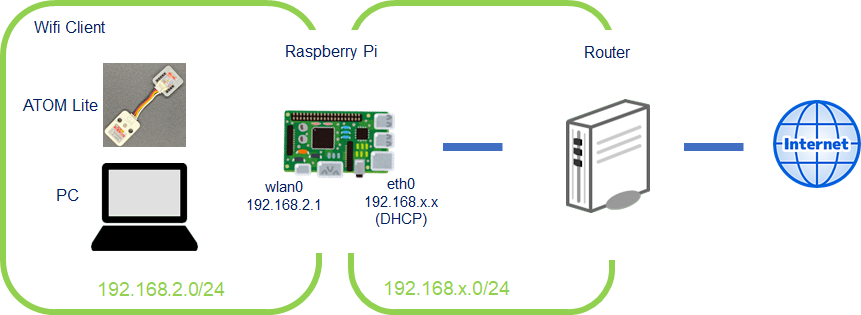
- アクセスポイント化にはhostapdを利用し、DHCPサーバはdnsmasqを利用する。
##4.1 ソフトウェアのインストール
hostapd、dnsmasq、及びiptables-persistentをインストールする。
iptables-persistentインストール時、「現在の IPv4 ルールを保存しますか?」「現在の IPv6 ルールを保存しますか?」と聞かれるので、両方とも「はい」を選択する。現在のフィルタリングルールが/etc/iptable/rule.v4 および /etc/iptables/rule.v6に保存される。
sudo apt install -y hostapd dnsmasq iptables-persistent
dnsmasqとhostapdのサービスを一旦終了させる。
sudo systemctl stop dnsmasq
sudo systemctl stop hostapd
##4.2 dhcpcd.confの変更
- Raspi-OSのネットワーク関連の設定は、dhcpcd.confに記述する。
- ネットワーク接続は、DHCPによるアドレス取得が基本。
- dhcpcd.conf には、固定アドレスのみ記述する。
- 今回は、Wifiのwlan0を固定アドレス192.168.2.1に設定する記述をする。
sudo nano /etc/dhcpcd.conf
最後尾に3行追記
interface wlan0
static ip_address=192.168.2.1/24
nohook wpa_supplicant
##4.3 dnsmasqの設定
DHCPで配布するIPアドレスのレンジを192.168.2.2~192.168.2.20とする。
今回は、DNSに関する部分はデフォルトのままとするので、インストールされているdnsmasq.confを退避させ、新たにDHCPだけ記述したdnsmasq.confファイルを作成する。
sudo mv /etc/dnsmasq.conf /etc/dnsmasq.conf.org
sudo nano /etc/dnsmasq.conf
以下の2行を追加する。
interface=wlan0
dhcp-range=192.168.2.2,192.168.2.20,255.255.255.0,24h
##4.4 無線LANのアクセスポイント化
###4.4.1 hostapdのデフォルト動作ファイルの編集
hostapdのデフォルト動作ファイルを編集し、hostapd.confの場所を指定する。
sudo nano /etc/default/hostapd
hostapd.confの場所は、/etc/hostapd/の配下とする。
#DAEMON_CONF=""
DAEMON_CONF="/etc/hostapd/hostapd.conf"
###4.2.3 hostapd.confファイルの作成
- 無線周波数帯はIEEE 802.11g
- 周波数チャンネルは1
- WPAは、バージョン2
sudo nano /etc/hostapd/hostapd.conf
以下の内容をコピー&ペーストして、SSIDのYOUR_SSIDとパスフレーズのYOUR_PASSPHRASEを適宜変更すること。
# 接続するインタフェース
interface=wlan0

# デバイスドライバ
driver=nl80211

# 利用する周波数帯IEEE 802.11g
hw_mode=g

# 使用するチャンネル
channel=1

# MACアドレスによるフィルタリングはオフ
macaddr_acl=0

# 認証アルゴリズムはWPAのみ
auth_algs=1

# SSIDのステルスはオフ
ignore_broadcast_ssid=0

# EEE 802.11acは無効
ieee80211ac=0

# WMM(QoS制御)有効
wmm_enabled=1

# 日本を指定
country_code=JP

# IEEE 802.11dとIEEE 802.11hは有効
ieee80211d=1
ieee80211h=1

# 無線LANの出力
local_pwr_constraint=3

# スペクトラム制御
spectrum_mgmt_required=1

# WPAのバージョンは2
wpa=2

# 共有鍵認証の方式
wpa_key_mgmt=WPA-PSK

# 暗号化方式
wpa_pairwise=CCMP

# 暗号化方式
rsn_pairwise=CCMP

# SSID
ssid=YOUR_SSID

# パスフレーズ
wpa_passphrase=YOUR_PASSPHRASE
hostapdのマスク解除、自動起動の設定
sudo systemctl unmask hostapd
sudo systemctl enable hostapd
##4.3 IPの転送
ipV4のポートフォワードをコメントアウトする。
sudo nano /etc/sysctl.conf
#net.ipv4.ip_forward=1
net.ipv4.ip_forward=1
##4.4 IPマスカレード
###4.4.1 iptablesによるIPマスカレードの設定
sudo iptables -t nat -A POSTROUTING -o eth0 -j MASQUERADE
###4.4.2 IPマスカレード設定ファイルの保存
上記のiptablesによるIPマスカレードの設定は、保存されないため、再起動すると再び上記コマンドを実行する必要がある。
netfilter-persistentコマンドで設定を保存する。
保存先は、iptables-persistentインストール時に作成された/etc/iptables/rules.v4、及びrules.v6となる。
sudo netfilter-persistent save
インストール時、「Save current IPv4 rules?」「Save current IPv6 rules?」と聞かれるので、両方とも「
はい」と答える。
/etc/iptable/rule.v4 および /etc/iptables/rule.v6に現在の設定状態が保存される。
#5.最後の仕上げ
##5.1 Lチカによるラズパイの稼働状況確認
ラズパイには、電源ラインのPWR LED(赤色)とSDカードへのアクセスを知らせるACT LED(緑色)がある。
これらを1秒間隔でONOFFするheartbeat設定することができる。
これを利用して稼働状況を確認できるようにする。
/boot配下にあるconfig.txtを編集して、最後尾に追記する。
sudo nano /boot/config.txt
今回は、視認性からPWR LEDをheartbeat化する。
PWR LEDの行頭をコメントアウトする。
# ACT LED(Green): heartbeat
#dtparam=act_led_trigger=heartbeat

# PWR LED(red): heartbeat
dtparam=pwr_led_trigger=heartbeat
##5.2 Node-REDを利用したシャットダウン
Raspi OSはGPIO3をGNDに接続することでシャットダウンできる。
通常は、スイッチ等を介してハード的にGNDに接続するが、今回はNode-REDを利用してソフト的にシャットダウンできるようにする。
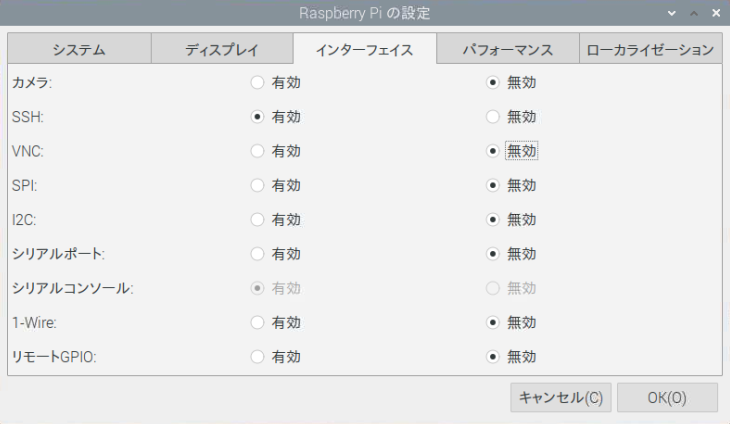
ここで、GPIO3はI2Cのクロック信号SCLと共有する作りになっているので、「RaspberryPiの設定」でI2Cが無効になっていることを確認する必要がある。
###5.2.1 /boot/config.txtの編集
sudo nano /boot/config.txt
最後尾に以下の2行を追加する。
# shutdown botton GPIO3 -> GND
dtoverlay=gpio-shutdown,gpio_pin=3
###5.2.2 Node-REDによるシャットダウンプログラム
Node-Redにアクセスし、Node-RED上にGPIO3をLowにするプログラムを作成し、デプロイする。
タイムスタンプを実行することで、シャットダウンできる。
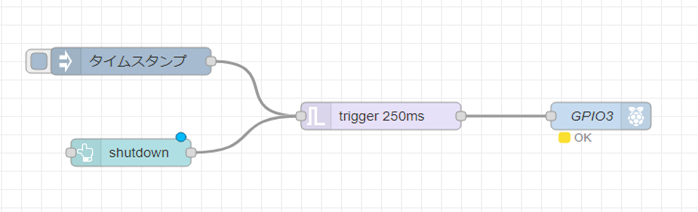
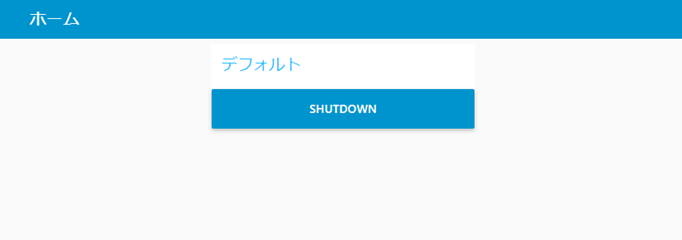
また、上記プログラムは、Node-REDのDashboardでもSHUTDOWNボタンを押すことでシャットダウンできる。
##5.3 コマンドラインブート
研修では、ラズパイのデスクトップ上で作業する項目はないので、ラズパイの負荷低減のためデスクトップを停止し、コマンドラインで起動するように変更する。
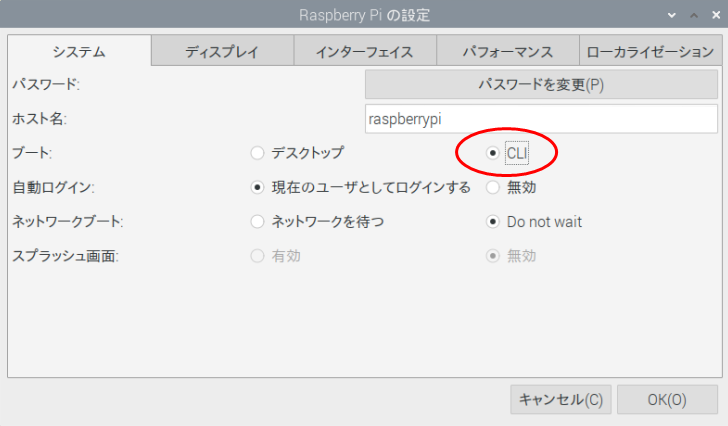
また、リモートで設定変更などをするために、SSHを有効にする。
##5.4 再起動
以上で、研修用のラズパイが完成したので、再起動(Reboot)する。