こんにちは自称計量東村アキコ学第一人者の @makito です。フォローやストックありがとうございます ![]() 先日書いた「プログラマーがRを始める時に知っていると便利なコマンドのまとめと3D散布図をつくる話 - RStudio は入れておきましょう」では3D散布図を rgl パッケージを使いWebGLで描画しました。できた3D散布図に最初にすることは決まっています。それは ぐりぐり動かす ことです。毎回やるなら、アニメーションとして出力できないか?
先日書いた「プログラマーがRを始める時に知っていると便利なコマンドのまとめと3D散布図をつくる話 - RStudio は入れておきましょう」では3D散布図を rgl パッケージを使いWebGLで描画しました。できた3D散布図に最初にすることは決まっています。それは ぐりぐり動かす ことです。毎回やるなら、アニメーションとして出力できないか?
やってみます。
 概要
概要
今回の話は「3D散布図をアニメーションGIFで出力」を試みます。
 これまで
これまで
rgl パッケージの plot3d や text3d を使用して次ような3D散布図を作成しました。
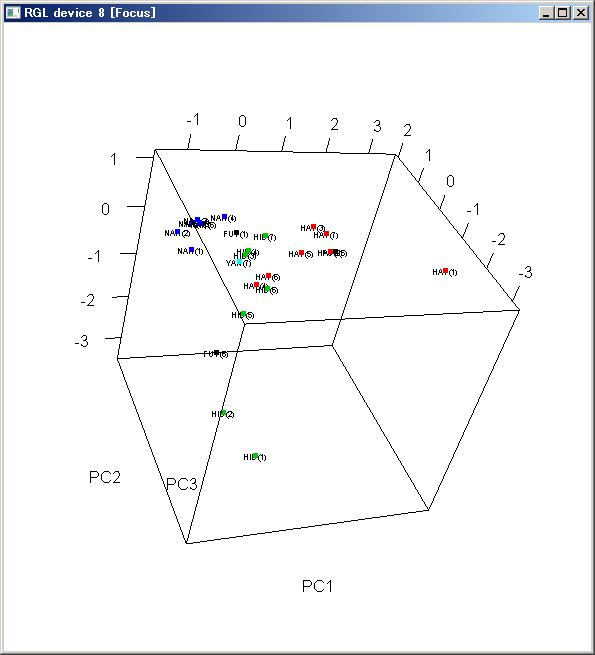
図1.plot3dを使った三次元散布図の例
参考記事: プログラマーがRを始める時に知っていると便利なコマンドのまとめと3D散布図をつくる話 - RStudio は入れておきましょう
 アニメーション作成方法
R には animation というそのまんまの名前のパッケージがあります。それを使ってみます。
アニメーションGIFをつくるということ
R は、標準出力的にグラフの表示ができます。例えば plot() 関数とか。特に出力先ウィンドウとかを指定する必要もなく、「とりあえず、表示」 できます。ウィンドウハンドラーとかそういうものを一切気にすることなく、OSを問わずデータをグラフ化できるのは本当に素敵ですね。
R には デバイス という概念があり、そのデバイスを切り替えることで、グラフの出力先をウィンドウ、画像、PDFファイルとか切り替えることができるようです。もしかしたらこの理解は間違っているかもしれませんが…
rgl パッケージを使用した時は、WebGLで出力されました。WebGLで出力されたということは、JavascriptなGL的な何かがあって、アニメーションGIFをつくるアプローチとはだいぶ違います。アニメーションGIFをつくるのは、ビットマップを何枚も重ねてパラパラ漫画のようにするので、まずビットマップを何枚も作る必要があります。そんなことを考えると rgl パッケージではアニメーションGIFはつくれなそうな気がします。
 rgl は使えませんか?
Provides medium to high level functions for 3D interactive graphics, including functions modelled on base graphics (plot3d(), etc.) as well as functions for constructing representations of geometric objects (cube3d(), etc.). Output may be on screen using OpenGL, or to various standard 3D file formats including WebGL, PLY, OBJ, STL as well as 2D image formats, including PNG, Postscript, SVG, PGF.
library(help=rgl) から抜粋
これを読むと rgl は確かに2D画像フォーマットへの出力に対応しています。できるかもしれません。少し大変そうなので、次回に持ち越して、違うパッケージを使ってみようと思います。タイトル詐欺? ![]() 怒らないでください
怒らないでください ![]()
パッケージ scatterplot3d を使う
普通に3D散布図が作成できるパッケージ scatterplot3d を使うことにします。「三次元散布図をRで描いてみた - ほくそ笑む - http://goo.gl/IUNSvG 」から拝借しました。 @hoxo_m さん毎回ありがとうございます。
 つくってみました
図2.scatterplot3dとanimationを使った三次元散布図のアニメーションGIF
# kakushika3danimation.R
library("animation")
library("scatterplot3d")

# set ImageMagick convert binary path
ani.options(convert = 'C:\\ImageMagick\\convert.exe')

# https://statmethods.wordpress.com/2012/01/30/getting-fancy-with-3-d-scatterplots/
plot3ds <- function(n) {
  for(i in 0:n) {
    s3d <- scatterplot3d(pcScores, angle = i*10+5, color=as.integer(data[,6]), pch=19)
    s3d.coords <- s3d$xyz.convert(pcScores)
    text(s3d.coords$x, s3d.coords$y,            # x and y coordinates
         labels=row.names(data),                # text to plot
         cex=1.0, pos=4)
  }
}


data <- read.csv('/work/tmp/kakukaku_lastchar_gt0.05_nakataless.csv', head=T, row.names=1)
# data <- read.csv('/work/tmp/kakukaku_lastchar_gt0.05.csv', head=T, row.names=1)

pca <- prcomp(data[1:5], scale=T, cor=TRUE)

pca

summary(pca)

pcScores <- pca$x[, 1:3]

saveGIF(plot3ds(30),interval=0.2,movie.name="kakushika3d.gif",img.name="scatterplot",convert="convert",outdir=getwd(),clean=T,width=640,height=480)
 おまけ
おまけ
参考にしたページ
 saveMovie, saveGIF, saveVideo とかの話
library(animation)
f<-4
wave<-function(n){w<-0;t<-seq(0,1,0.01);for(k in 1:n){w<-w+sin((2*k-1)*2*pi*f*t)/(2*k-1)};w<-4/pi*w}
wave2<-function(x){for(n in 1:x){plot(x=seq(0,1,0.01),y=wave(n),type="l",main=paste("Square wave(n=",n,")"),xlab="Time(sec)",ylab="Amplitude")}}
saveMovie(wave2(30),interval=0.5,moviename="wave",movietype="gif",outdir=getwd(),width=640,height=480)
図おまけ1.SheepCloud blog さんから拝借した画像
SheepCloud blog: Rでアニメーション - http://goo.gl/yJvBbb
ところで、 library(help=animation) で見ると saveMovie はありません。その他
- saveGIF
- saveHTML
- save Latex
- saveSWF
- saveVideo
がありました(Ver 2.4)。saveGIF, saveVideo が気になりますが、saveGIF はImageMagick を saveVideo は ffmpeg を使用するようです。
$ ?saveMovie
すると、saveGIF のヘルプが表示されるので、エイリアスでしょうか…
幸い、ImageMagick も ffmpeg も手元の環境に入っていたのでどちらも使えそうです。
実行すると
Error: could not find function "saveMovie"
と怒られます。saveMovieはやはり無いようですね。どっちなんですか?![]() そこで、
そこで、saveMovieをそのままsaveGIFに書き換えると
入力行が長すぎます。
と怒られました。その後、マニュアル見たりして、書き換えたコードと作成したアニメーションGIFはこちら。
library(animation)
f<-4
wave<-function(n){w<-0;t<-seq(0,1,0.01);for(k in 1:n){w<-w+sin((2*k-1)*2*pi*f*t)/(2*k-1)};w<-4/pi*w}
wave2<-function(x){for(n in 1:x){plot(x=seq(0,1,0.01),y=wave(n),type="l",main=paste("Square wave(n=",n,")"),xlab="Time(sec)",ylab="Amplitude")}}

# ImageMagick の convert.exe が確実に使われるように絶対パスを指定
ani.options(convert = 'C:\\ImageMagick\\convert.exe')

# マニュアルに合わせて引数を指定
saveGIF(wave2(5),interval=0.5,movie.name="wave.gif",img.name="Rplot",convert="convert",outdir=getwd(),clean=T,width=640,height=480)
図おまけ2.出来上がった画像
GLじゃない三次元散布図パッケージ scatterplot3d
Rに役立つポエムを提供する団体ホクソエムのブログ「三次元散布図をRで描いてみた - ほくそ笑む - http://goo.gl/IUNSvG 」を参考に scatterplot3d を使用してみます。
library("animation")
library("scatterplot3d")
ani.start()
for(i in 0:35) {
  scatterplot3d(trees, angle = i*10+5)
}
ani.stop()
> ani.start()
Error: This function is defunct. Use animation::saveHTML() instead.
となり失敗しました。こんな感じではどうでしょうか?
library("animation")
library("scatterplot3d")

plot3ds <- function(n) {
  for(i in 0:n) {
    scatterplot3d(trees, angle = i*10+5)
  }
}

ani.options(convert = 'C:\\ImageMagick\\convert.exe')

saveGIF(plot3ds(30),interval=0.5,movie.name="scatterplot3d.gif",img.name="scatterplot",convert="convert",outdir=getwd(),clean=T,width=640,height=480)
うまくいきました。
図おまけ3.scatterplot3dを使って作成したアニメーションGIF
R Markdown でアニメーション ffmpeg が内部的に使用されるらしい
```{r clock, fig.width=7, fig.height=6, fig.show='animate'}
par(mar = rep(3, 4))
for (i in seq(pi/2, -4/3 * pi, length = 12)) {
    plot(0, 0, pch = 20, ann = FALSE, axes = FALSE)
    arrows(0, 0, cos(i), sin(i))
    axis(1, 0, "VI"); axis(2, 0, "IX")
    axis(3, 0, "XII"); axis(4, 0, "III"); box()
}
Combining R Markdown and Animation Package - Stack Overflow - http://goo.gl/IvjmAa
 R Markdown 始めました、勉強中です
Rを始めて1週間ぐらいです。まだまだ勉強中です。R Markdownも始めました。覚えることがたくさんありますので、カンニングペーパーをつくりました。
コードブロック用のオプションチートシート
| オプション | デフォルト | 効果 |
|---|---|---|
| eval | TRUE | コードを実行して結果を文書に含めるか |
| echo | TRUE | コードを結果と一緒に表示するか |
| warning | TRUE | 警告を表示するか |
| error | FALSE | エラーを表示するか |
| message | TRUE | メッセージを表示するか |
| tidy | FALSE | コードを整形するか |
| results | "markup" | "markup", "asis", "hold", or "hide" |
| cache | FALSE | 結果をキャッシュするか |
| comment | "##" | 出力文字列の頭に付ける文字 |
| fig.width | 7 | 幅(インチ) |
| fig.height | 7 | 高さ(インチ) |
| fig.show | "asis" | "asis","hold","animate","hide" asis show plots exactly in places where they were generated (as if the code were run in an R terminal) hold hold all plots and output them in the very end of a code chunk animate wrap all plots into an animation if there are mutiple plots in a chunk hide generate plot files but hide them in the output document |
出典: http://www.rstudio.com/wp-content/uploads/2015/02/rmarkdown-cheatsheet.pdf とか http://yihui.name/knitr/options/#chunk_options
データの可視化(ビジュアライジング)について
"Visualizaing Data" (邦訳『ビジュアライジング・データ』) で紹介されていた、データ可視化の7ステージ(The Seven Stages of Visualizing Data)。分析に手を付ける前に思い出すと、スムーズに課題を整理できる。でも、出てきた課題をそれぞれどう解決するかは別の話。
- Acquire: データを手に入れる。
- Parse: 生のデータを構造化する。
- Filter: 不要なデータを取り除く。
- Mine: 統計・マイニング手法を適用する。
- Represent: 基本的な可視化モデル(棒グラフ、散布図、ツリーなど)で表現する。
- Refine: 基本的な可視化モデルを洗練させる。
- Interact: 可視化モデルを操作できるようにする。
Mirror House Lab: データ可視化の7ステージ - http://goo.gl/zLGFH5