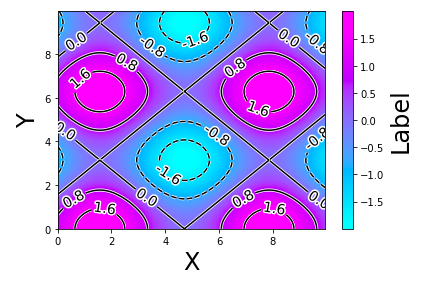
import numpy as np
import matplotlib.pyplot as plt

x = np.arange(0, 10, 0.05)
y = np.arange(0, 10, 0.05)

X, Y = np.meshgrid(x, y)
Z = np.sin(X) + np.cos(Y)

plt.setp(cntr.collections, path_effects=[
    patheffects.withStroke(linewidth=3, foreground="w")])

cont=plt.contour(X,Y,Z,  5, vmin=-1,vmax=1, colors=['black'])
plt.setp(cont.collections, path_effects=[
    patheffects.withStroke(linewidth=3, foreground="w")])
cl=cont.clabel(fmt='%1.1f', fontsize=14)
plt.setp(cl, path_effects=[
    patheffects.withStroke(linewidth=3, foreground="w")])


plt.xlabel('X', fontsize=24)
plt.ylabel('Y', fontsize=24)


plt.pcolormesh(X,Y,Z, cmap='cool')
pp=plt.colorbar (orientation="vertical")
pp.set_label("Label",  fontsize=24)

plt.show()
