x-y座標でグラフを書く方法
自分の覚書として書く。
一つのグラフ
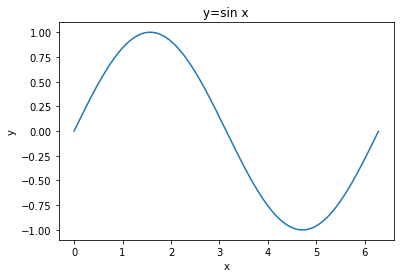
下のグラフはarrangeを用いて $y=\sin x$ のグラフを $x-y$ 平面に $\Delta x=0.01$ おきに $0$ から $2\pi $ までプロットしたものである。
linspace等を用いる方法もある。
import numpy as np
import matplotlib.pylab as plt

x = np.arange(0, 2*np.pi, 0.01)
plt.plot(x,np.sin(x))
plt.title('y=sin x')
plt.xlabel('x')
plt.ylabel('y')
plt.show()
plt.showでグラフを表示する。
複数のグラフ
import numpy as np
import matplotlib.pylab as plt

x = np.arange(0, 2*np.pi, 0.01)
plt.plot(x, np.sin(x),label="y=sin x")
plt.plot(x, np.cos(x), label="y=cos x")

plt.title('')
plt.xlabel('x')
plt.ylabel('y')
plt.legend()
plt.show()
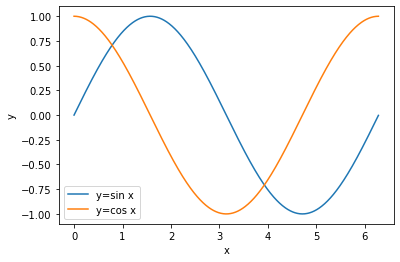
グラフが複数になるとどのグラフだか判別するための凡例が必要。plt.legendで凡例を表示できる。そのときplotの中でラベリングすることを忘れずに。